29
/
en
AIzaSyAYiBZKx7MnpbEhh9jyipgxe19OcubqV5w
April 1, 2024
108924
Comoros
COM
true
2
1
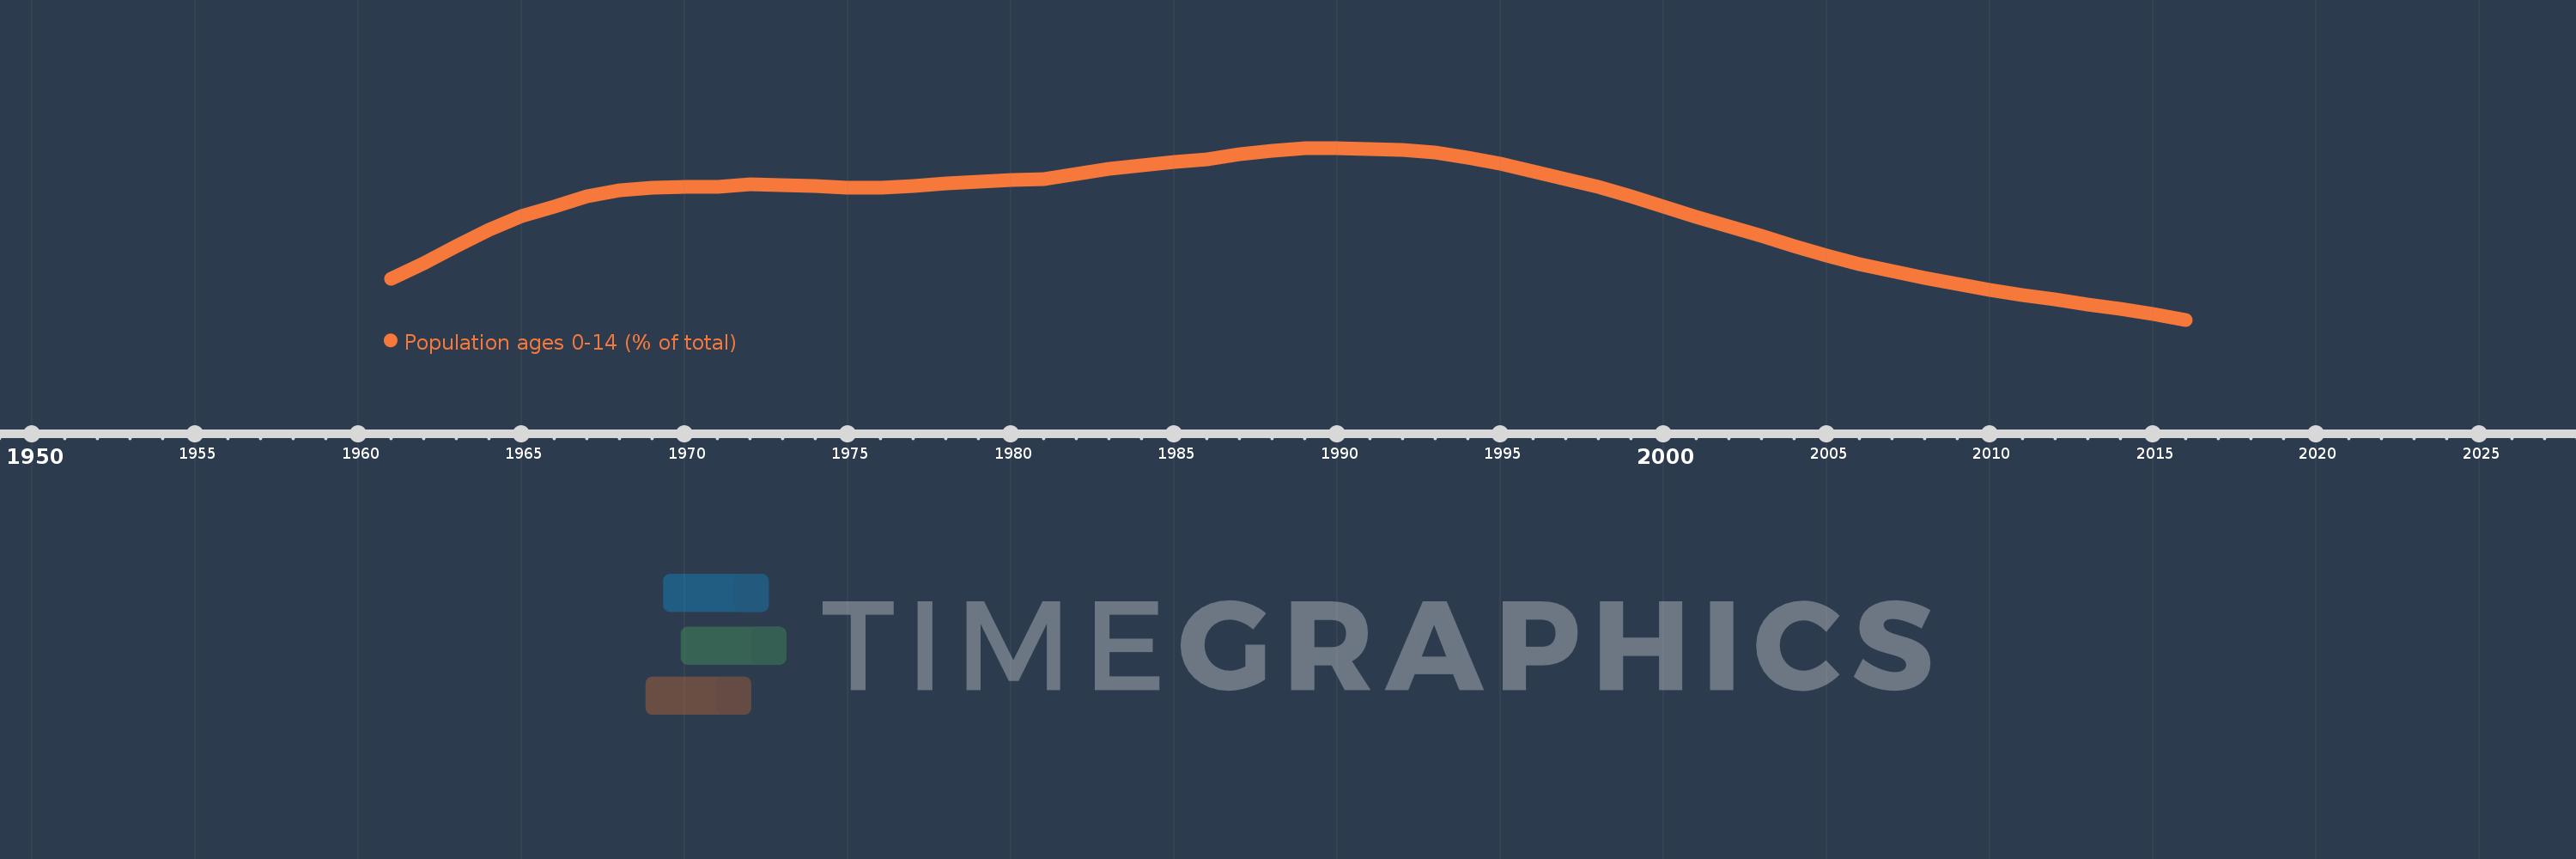
Population ages 0-14 (% of total)
2016,2015,2014,2013,2012,2011,2010,2009,2008,2007,2006,2005,2004,2003,2002,2001,2000,1999,1998,1997,1996,1995,1994,1993,1992,1991,1990,1989,1988,1987,1986,1985,1984,1983,1982,1981,1980,1979,1978,1977,1976,1975,1974,1973,1972,1971,1970,1969,1968,1967,1966,1965,1964,1963,1962,1961
This statistics in other country:
AfghanistanAlbaniaAlgeriaAngolaAntigua and BarbudaArab WorldArgentinaArmeniaArubaAustraliaAustriaAzerbaijanBahamas, TheBahrainBangladeshBarbadosBelarusBelgiumBelizeBeninBhutanBoliviaBosnia and HerzegovinaBotswanaBrazilBrunei DarussalamBulgariaBurkina FasoBurundiCabo VerdeCambodiaCameroonCanadaCaribbean small statesCentral African RepublicCentral Europe and the BalticsChadChannel IslandsChileChinaColombiaComorosCongo, Dem. Rep.Congo, Rep.Costa RicaCote d'IvoireCroatiaCubaCuracaoCyprusCzech RepublicDenmarkDjiboutiDominican RepublicEarly-demographic dividendEast Asia & PacificEast Asia & Pacific (excluding high income)East Asia & Pacific (IDA & IBRD countries)EcuadorEgypt, Arab Rep.El SalvadorEquatorial GuineaEritreaEstoniaEthiopiaEuro areaEurope & Central AsiaEurope & Central Asia (excluding high income)Europe & Central Asia (IDA & IBRD countries)European UnionFijiFinlandFragile and conflict affected situationsFranceFrench PolynesiaGabonGambia, TheGeorgiaGermanyGhanaGreeceGrenadaGuamGuatemalaGuineaGuinea-BissauGuyanaHaitiHeavily indebted poor countries (HIPC)High incomeHondurasHong Kong SAR, ChinaHungaryIBRD onlyIcelandIDA & IBRD totalIDA blendIDA onlyIDA totalIndiaIndonesiaIran, Islamic Rep.IraqIrelandIsraelItalyJamaicaJapanJordanKazakhstanKenyaKiribatiKorea, Dem. People’s Rep.Korea, Rep.KosovoKuwaitKyrgyz RepublicLao PDRLate-demographic dividendLatin America & Caribbean Latin America & Caribbean (excluding high income)Latin America & the Caribbean (IDA & IBRD countries)LatviaLeast developed countries: UN classificationLebanonLesothoLiberiaLibyaLithuaniaLow & middle incomeLow incomeLower middle incomeLuxembourgMacao SAR, ChinaMacedonia, FYRMadagascarMalawiMalaysiaMaldivesMaliMaltaMauritaniaMauritiusMexicoMicronesia, Fed. Sts.Middle East & North AfricaMiddle East & North Africa (excluding high income)Middle East & North Africa (IDA & IBRD countries)Middle incomeMoldovaMongoliaMontenegroMoroccoMozambiqueMyanmarNamibiaNepalNetherlandsNew CaledoniaNew ZealandNicaraguaNigerNigeriaNorth AmericaNorwayOECD membersOmanOther small statesPacific island small statesPakistanPanamaPapua New GuineaParaguayPeruPhilippinesPolandPortugalPost-demographic dividendPre-demographic dividendPuerto RicoQatarRomaniaRussian FederationRwandaSamoaSao Tome and PrincipeSaudi ArabiaSenegalSerbiaSeychellesSierra LeoneSingaporeSlovak RepublicSloveniaSmall statesSolomon IslandsSomaliaSouth AfricaSouth AsiaSouth Asia (IDA & IBRD)South SudanSpainSri LankaSt. LuciaSt. Vincent and the GrenadinesSub-Saharan Africa Sub-Saharan Africa (excluding high income)Sub-Saharan Africa (IDA & IBRD countries)SudanSurinameSwazilandSwedenSwitzerlandSyrian Arab RepublicTajikistanTanzaniaThailandTimor-LesteTogoTongaTrinidad and TobagoTunisiaTurkeyTurkmenistanUgandaUkraineUnited Arab EmiratesUnited KingdomUnited StatesUpper middle incomeUruguayUzbekistanVanuatuVenezuela, RBVietnamVirgin Islands (U.S.)West Bank and GazaWorldYemen, Rep.ZambiaZimbabwe Timeline:
This timeline shows a graph from 1961 to 2016 of Comoros. No data until 1960. Number of actual observations by date: 56.
Source name:
World Development Indicators
Source organization:
World Bank staff estimates based on age distributions of United Nations Population Division's World Population Prospects.
Categories, topics:
Education, Health
Last updated:
apr 23, 2017
Indicators value changes by year
Minimum:
40.274
jan 1, 2016
Maximum:
46.557
jan 1, 1990
At the date of observation
Value
Absolute change
Change from previous value
jan 1, 1961
41.76
+41.76
0.0%
jan 1, 1962
42.35
+0.59
1.41%
jan 1, 1963
42.967
+0.617
1.46%
jan 1, 1964
43.563
+0.596
1.39%
jan 1, 1965
44.058
+0.494
1.13%
jan 1, 1966
44.418
+0.36
0.82%
jan 1, 1967
44.783
+0.366
0.82%
jan 1, 1968
45.003
+0.22
0.49%
jan 1, 1969
45.111
+0.108
0.24%
jan 1, 1970
45.148
+0.037
0.08%
jan 1, 1971
45.135
-0.013
-0.03%
jan 1, 1972
45.213
+0.078
0.17%
jan 1, 1973
45.208
-0.004
-0.01%
jan 1, 1974
45.156
-0.052
-0.12%
jan 1, 1975
45.105
-0.051
-0.11%
jan 1, 1976
45.101
-0.004
-0.01%
jan 1, 1977
45.176
+0.075
0.17%
jan 1, 1978
45.244
+0.068
0.15%
jan 1, 1979
45.316
+0.071
0.16%
jan 1, 1980
45.377
+0.061
0.13%
jan 1, 1981
45.406
+0.029
0.06%
jan 1, 1982
45.609
+0.203
0.45%
jan 1, 1983
45.784
+0.175
0.38%
jan 1, 1984
45.93
+0.146
0.32%
jan 1, 1985
46.05
+0.12
0.26%
jan 1, 1986
46.148
+0.098
0.21%
jan 1, 1987
46.342
+0.194
0.42%
jan 1, 1988
46.467
+0.125
0.27%
jan 1, 1989
46.537
+0.071
0.15%
jan 1, 1990
46.557
+0.02
0.04%
jan 1, 1991
46.523
-0.034
-0.07%
jan 1, 1992
46.485
-0.038
-0.08%
jan 1, 1993
46.378
-0.106
-0.23%
jan 1, 1994
46.211
-0.167
-0.36%
jan 1, 1995
45.988
-0.223
-0.48%
jan 1, 1996
45.714
-0.274
-0.6%
jan 1, 1997
45.432
-0.282
-0.62%
jan 1, 1998
45.123
-0.308
-0.68%
jan 1, 1999
44.786
-0.337
-0.75%
jan 1, 2000
44.418
-0.368
-0.82%
jan 1, 2001
44.022
-0.397
-0.89%
jan 1, 2002
43.7
-0.321
-0.73%
jan 1, 2003
43.346
-0.354
-0.81%
jan 1, 2004
42.978
-0.367
-0.85%
jan 1, 2005
42.625
-0.354
-0.82%
jan 1, 2006
42.299
-0.326
-0.76%
jan 1, 2007
42.048
-0.251
-0.59%
jan 1, 2008
41.812
-0.236
-0.56%
jan 1, 2009
41.59
-0.222
-0.53%
jan 1, 2010
41.375
-0.215
-0.52%
jan 1, 2011
41.163
-0.213
-0.51%
jan 1, 2012
41.006
-0.157
-0.38%
jan 1, 2013
40.84
-0.166
-0.4%
jan 1, 2014
40.665
-0.175
-0.43%
jan 1, 2015
40.478
-0.187
-0.46%
jan 1, 2016
40.274
-0.204
-0.5%
Ranking of countries by current statistics by years


Comments: