29
/
en
AIzaSyAYiBZKx7MnpbEhh9jyipgxe19OcubqV5w
April 1, 2024
129771
Estonia
EST
true
2
1
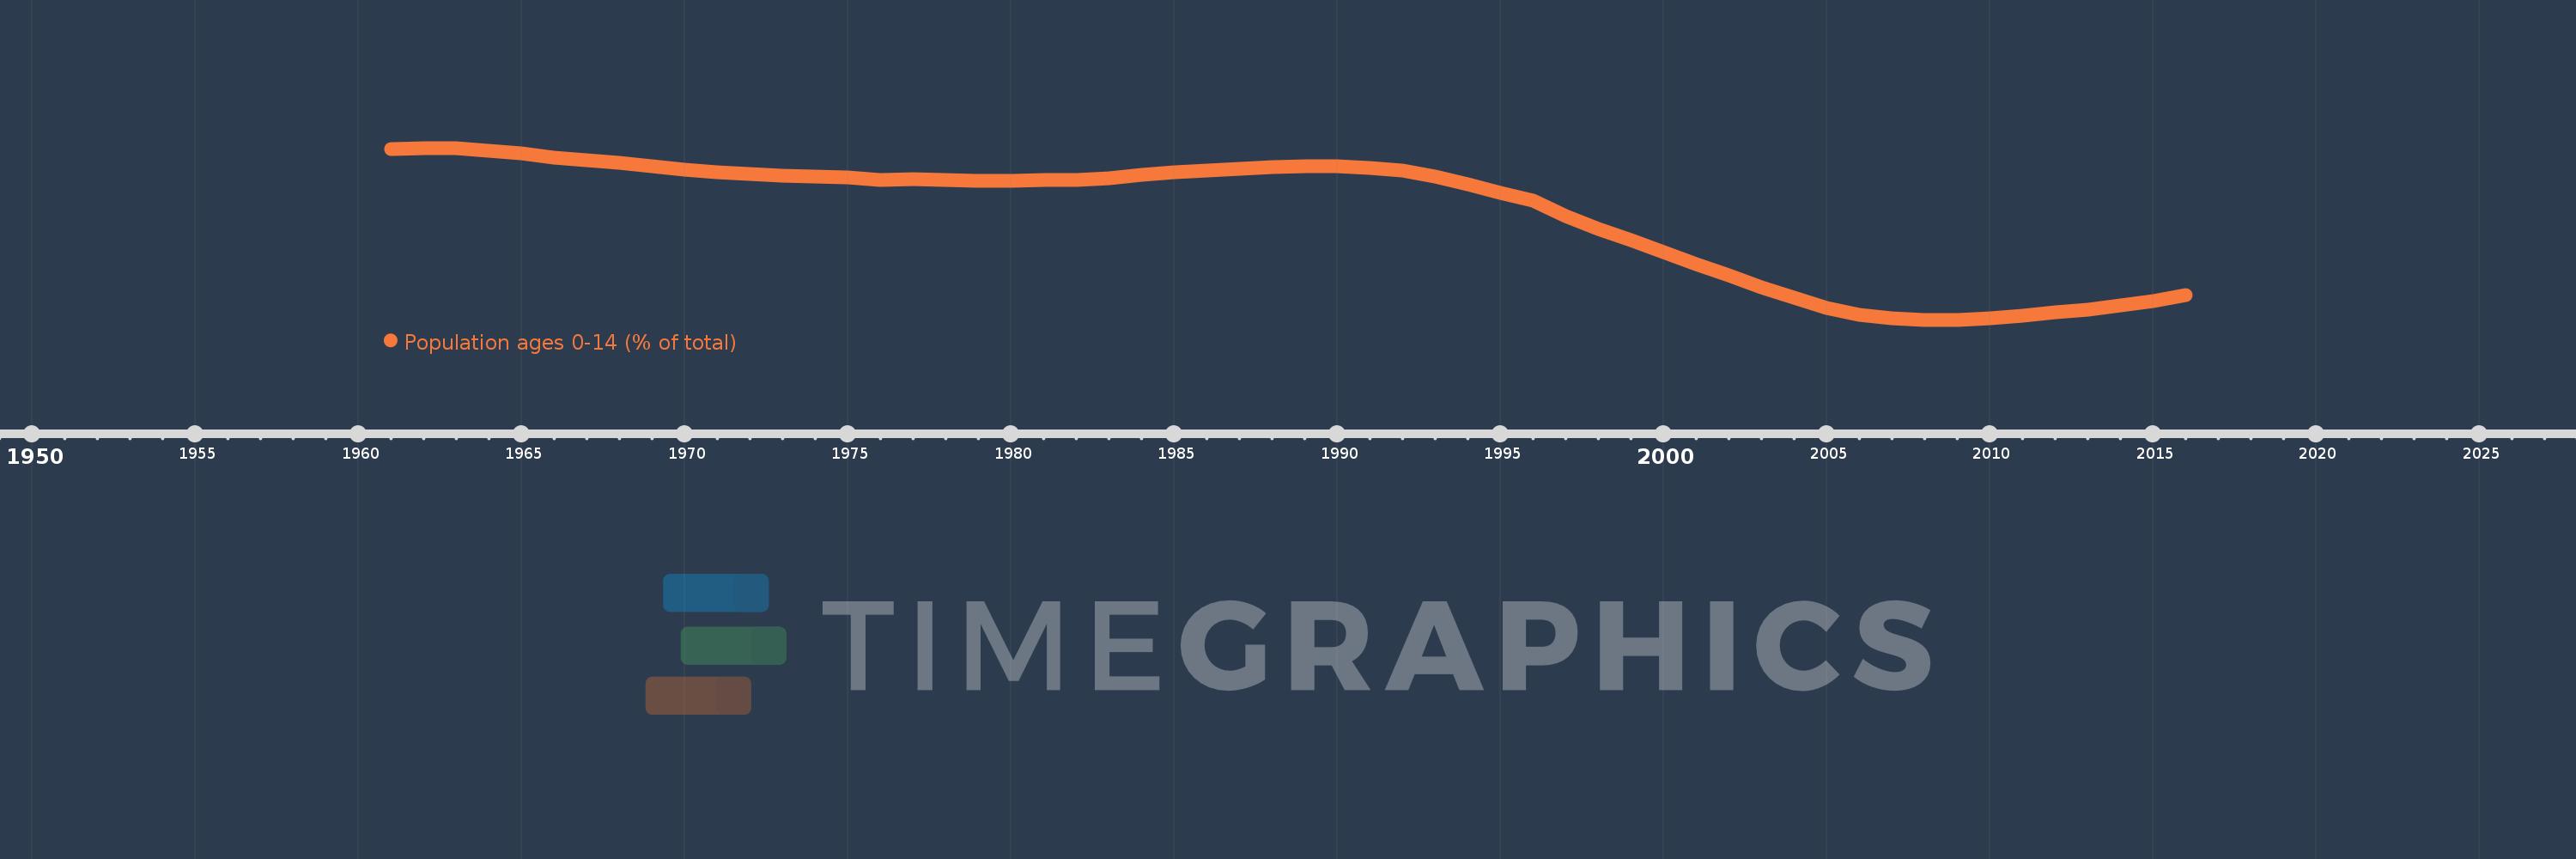
Population ages 0-14 (% of total)
2016,2015,2014,2013,2012,2011,2010,2009,2008,2007,2006,2005,2004,2003,2002,2001,2000,1999,1998,1997,1996,1995,1994,1993,1992,1991,1990,1989,1988,1987,1986,1985,1984,1983,1982,1981,1980,1979,1978,1977,1976,1975,1974,1973,1972,1971,1970,1969,1968,1967,1966,1965,1964,1963,1962,1961
This statistics in other country:
AfghanistanAlbaniaAlgeriaAngolaAntigua and BarbudaArab WorldArgentinaArmeniaArubaAustraliaAustriaAzerbaijanBahamas, TheBahrainBangladeshBarbadosBelarusBelgiumBelizeBeninBhutanBoliviaBosnia and HerzegovinaBotswanaBrazilBrunei DarussalamBulgariaBurkina FasoBurundiCabo VerdeCambodiaCameroonCanadaCaribbean small statesCentral African RepublicCentral Europe and the BalticsChadChannel IslandsChileChinaColombiaComorosCongo, Dem. Rep.Congo, Rep.Costa RicaCote d'IvoireCroatiaCubaCuracaoCyprusCzech RepublicDenmarkDjiboutiDominican RepublicEarly-demographic dividendEast Asia & PacificEast Asia & Pacific (excluding high income)East Asia & Pacific (IDA & IBRD countries)EcuadorEgypt, Arab Rep.El SalvadorEquatorial GuineaEritreaEstoniaEthiopiaEuro areaEurope & Central AsiaEurope & Central Asia (excluding high income)Europe & Central Asia (IDA & IBRD countries)European UnionFijiFinlandFragile and conflict affected situationsFranceFrench PolynesiaGabonGambia, TheGeorgiaGermanyGhanaGreeceGrenadaGuamGuatemalaGuineaGuinea-BissauGuyanaHaitiHeavily indebted poor countries (HIPC)High incomeHondurasHong Kong SAR, ChinaHungaryIBRD onlyIcelandIDA & IBRD totalIDA blendIDA onlyIDA totalIndiaIndonesiaIran, Islamic Rep.IraqIrelandIsraelItalyJamaicaJapanJordanKazakhstanKenyaKiribatiKorea, Dem. People’s Rep.Korea, Rep.KosovoKuwaitKyrgyz RepublicLao PDRLate-demographic dividendLatin America & Caribbean Latin America & Caribbean (excluding high income)Latin America & the Caribbean (IDA & IBRD countries)LatviaLeast developed countries: UN classificationLebanonLesothoLiberiaLibyaLithuaniaLow & middle incomeLow incomeLower middle incomeLuxembourgMacao SAR, ChinaMacedonia, FYRMadagascarMalawiMalaysiaMaldivesMaliMaltaMauritaniaMauritiusMexicoMicronesia, Fed. Sts.Middle East & North AfricaMiddle East & North Africa (excluding high income)Middle East & North Africa (IDA & IBRD countries)Middle incomeMoldovaMongoliaMontenegroMoroccoMozambiqueMyanmarNamibiaNepalNetherlandsNew CaledoniaNew ZealandNicaraguaNigerNigeriaNorth AmericaNorwayOECD membersOmanOther small statesPacific island small statesPakistanPanamaPapua New GuineaParaguayPeruPhilippinesPolandPortugalPost-demographic dividendPre-demographic dividendPuerto RicoQatarRomaniaRussian FederationRwandaSamoaSao Tome and PrincipeSaudi ArabiaSenegalSerbiaSeychellesSierra LeoneSingaporeSlovak RepublicSloveniaSmall statesSolomon IslandsSomaliaSouth AfricaSouth AsiaSouth Asia (IDA & IBRD)South SudanSpainSri LankaSt. LuciaSt. Vincent and the GrenadinesSub-Saharan Africa Sub-Saharan Africa (excluding high income)Sub-Saharan Africa (IDA & IBRD countries)SudanSurinameSwazilandSwedenSwitzerlandSyrian Arab RepublicTajikistanTanzaniaThailandTimor-LesteTogoTongaTrinidad and TobagoTunisiaTurkeyTurkmenistanUgandaUkraineUnited Arab EmiratesUnited KingdomUnited StatesUpper middle incomeUruguayUzbekistanVanuatuVenezuela, RBVietnamVirgin Islands (U.S.)West Bank and GazaWorldYemen, Rep.ZambiaZimbabwe Timeline:
This timeline shows a graph from 1961 to 2016 of Estonia. No data until 1960. Number of actual observations by date: 56.
Source name:
World Development Indicators
Source organization:
World Bank staff estimates based on age distributions of United Nations Population Division's World Population Prospects.
Categories, topics:
Education, Health
Last updated:
apr 23, 2017
Indicators value changes by year
Minimum:
14.923
jan 1, 2008
Maximum:
23.161
jan 1, 1962
At the date of observation
Value
Absolute change
Change from previous value
jan 1, 1961
23.1
+23.1
0.0%
jan 1, 1962
23.161
+0.062
0.27%
jan 1, 1963
23.143
-0.018
-0.08%
jan 1, 1964
23.04
-0.103
-0.44%
jan 1, 1965
22.886
-0.154
-0.67%
jan 1, 1966
22.712
-0.174
-0.76%
jan 1, 1967
22.585
-0.127
-0.56%
jan 1, 1968
22.43
-0.155
-0.69%
jan 1, 1969
22.267
-0.162
-0.72%
jan 1, 1970
22.125
-0.142
-0.64%
jan 1, 1971
22.015
-0.11
-0.5%
jan 1, 1972
21.905
-0.111
-0.5%
jan 1, 1973
21.843
-0.062
-0.28%
jan 1, 1974
21.802
-0.041
-0.19%
jan 1, 1975
21.734
-0.068
-0.31%
jan 1, 1976
21.621
-0.113
-0.52%
jan 1, 1977
21.665
+0.044
0.2%
jan 1, 1978
21.634
-0.031
-0.14%
jan 1, 1979
21.577
-0.057
-0.26%
jan 1, 1980
21.565
-0.012
-0.06%
jan 1, 1981
21.623
+0.059
0.27%
jan 1, 1982
21.623
-0.001
0.0%
jan 1, 1983
21.714
+0.091
0.42%
jan 1, 1984
21.855
+0.141
0.65%
jan 1, 1985
21.98
+0.125
0.57%
jan 1, 1986
22.061
+0.082
0.37%
jan 1, 1987
22.159
+0.098
0.44%
jan 1, 1988
22.237
+0.078
0.35%
jan 1, 1989
22.29
+0.053
0.24%
jan 1, 1990
22.288
-0.002
-0.01%
jan 1, 1991
22.182
-0.106
-0.47%
jan 1, 1992
22.067
-0.115
-0.52%
jan 1, 1993
21.801
-0.266
-1.2%
jan 1, 1994
21.42
-0.381
-1.75%
jan 1, 1995
21.004
-0.416
-1.94%
jan 1, 1996
20.616
-0.388
-1.85%
jan 1, 1997
19.898
-0.718
-3.48%
jan 1, 1998
19.28
-0.618
-3.1%
jan 1, 1999
18.732
-0.548
-2.84%
jan 1, 2000
18.178
-0.554
-2.96%
jan 1, 2001
17.583
-0.596
-3.28%
jan 1, 2002
17.04
-0.542
-3.08%
jan 1, 2003
16.496
-0.544
-3.19%
jan 1, 2004
15.964
-0.532
-3.22%
jan 1, 2005
15.503
-0.461
-2.89%
jan 1, 2006
15.157
-0.346
-2.23%
jan 1, 2007
15.007
-0.15
-0.99%
jan 1, 2008
14.923
-0.084
-0.56%
jan 1, 2009
14.924
+0.001
0.01%
jan 1, 2010
15.002
+0.078
0.52%
jan 1, 2011
15.133
+0.132
0.88%
jan 1, 2012
15.28
+0.147
0.97%
jan 1, 2013
15.423
+0.143
0.94%
jan 1, 2014
15.597
+0.174
1.13%
jan 1, 2015
15.823
+0.225
1.44%
jan 1, 2016
16.088
+0.265
1.68%
Ranking of countries by current statistics by years


Comments: