29
/
en
AIzaSyAYiBZKx7MnpbEhh9jyipgxe19OcubqV5w
April 1, 2024
39372
IDA only
IDX
false
2
1
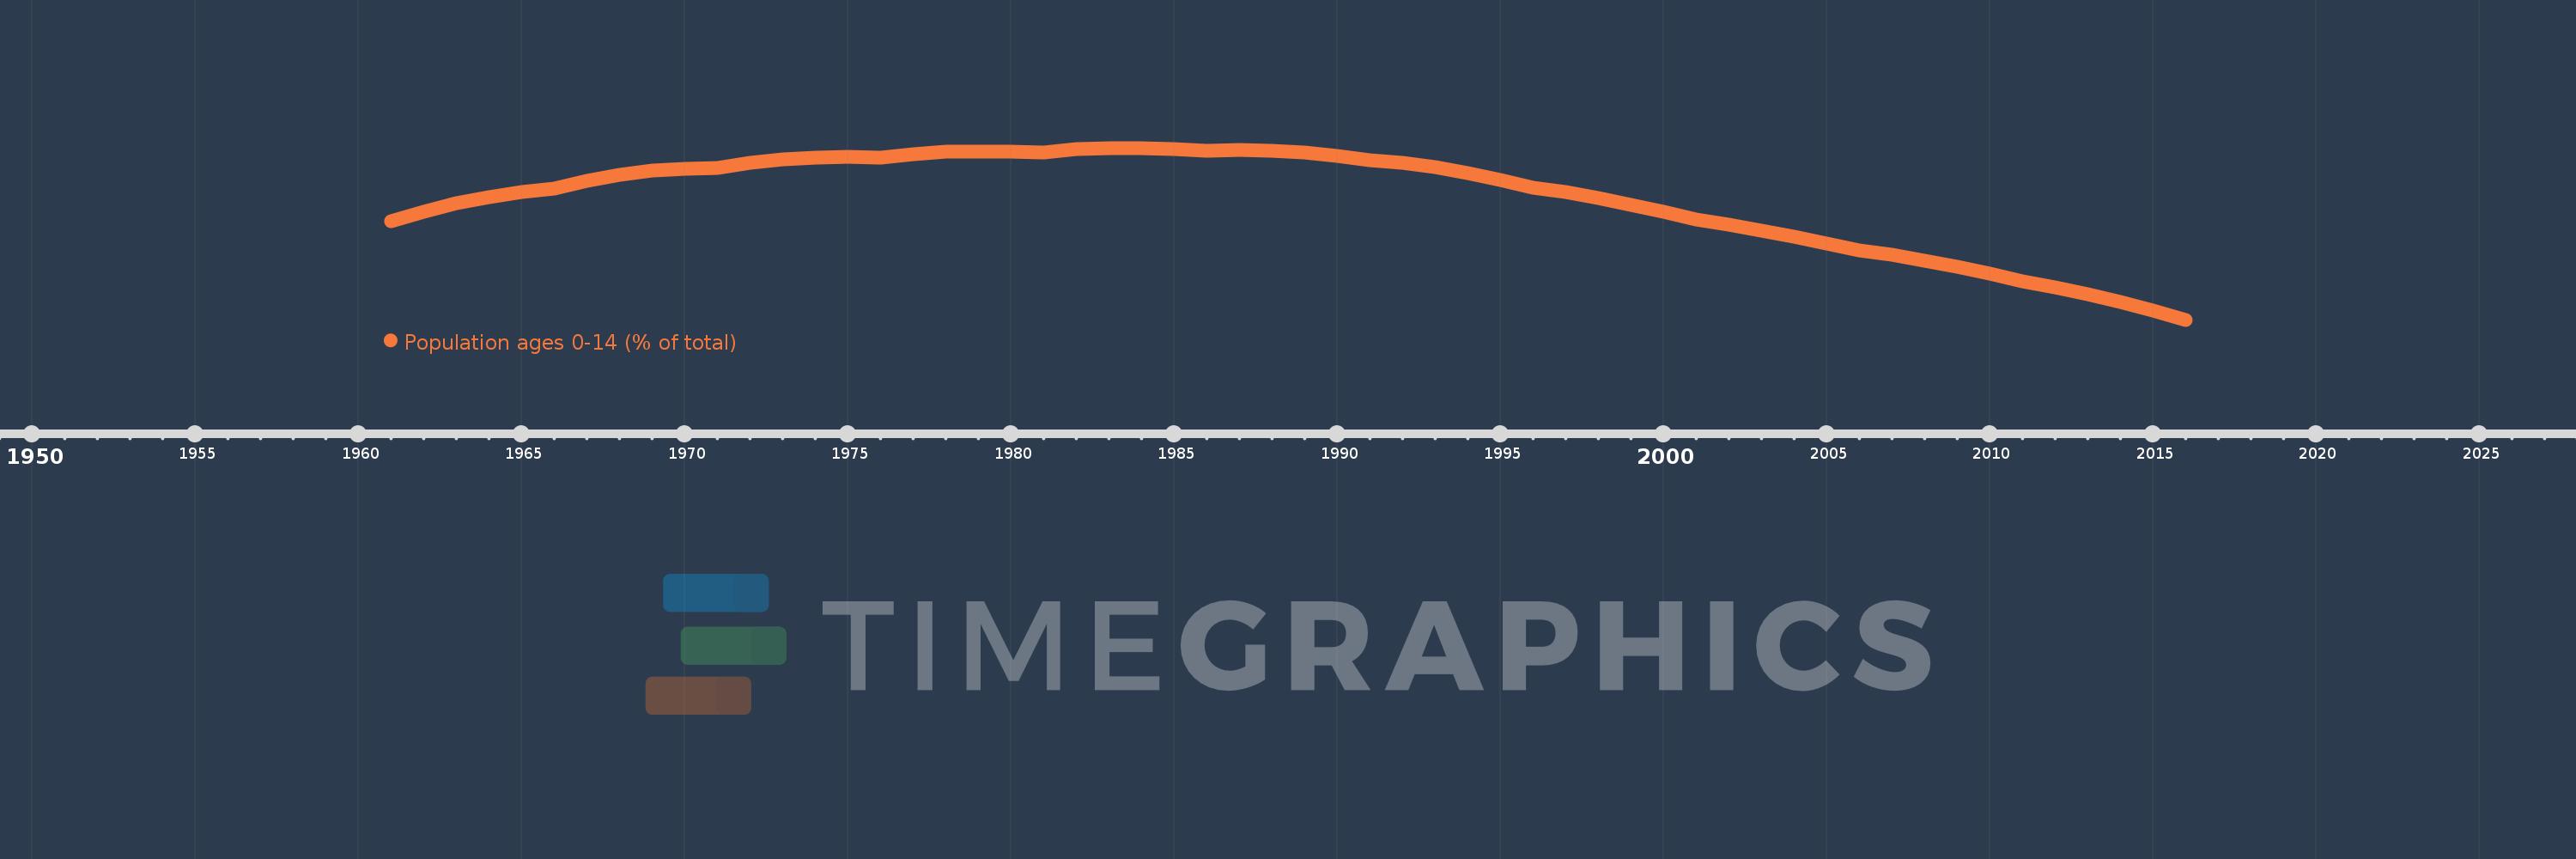
Population ages 0-14 (% of total)
2016,2015,2014,2013,2012,2011,2010,2009,2008,2007,2006,2005,2004,2003,2002,2001,2000,1999,1998,1997,1996,1995,1994,1993,1992,1991,1990,1989,1988,1987,1986,1985,1984,1983,1982,1981,1980,1979,1978,1977,1976,1975,1974,1973,1972,1971,1970,1969,1968,1967,1966,1965,1964,1963,1962,1961
This statistics in other country:
AfghanistanAlbaniaAlgeriaAngolaAntigua and BarbudaArab WorldArgentinaArmeniaArubaAustraliaAustriaAzerbaijanBahamas, TheBahrainBangladeshBarbadosBelarusBelgiumBelizeBeninBhutanBoliviaBosnia and HerzegovinaBotswanaBrazilBrunei DarussalamBulgariaBurkina FasoBurundiCabo VerdeCambodiaCameroonCanadaCaribbean small statesCentral African RepublicCentral Europe and the BalticsChadChannel IslandsChileChinaColombiaComorosCongo, Dem. Rep.Congo, Rep.Costa RicaCote d'IvoireCroatiaCubaCuracaoCyprusCzech RepublicDenmarkDjiboutiDominican RepublicEarly-demographic dividendEast Asia & PacificEast Asia & Pacific (excluding high income)East Asia & Pacific (IDA & IBRD countries)EcuadorEgypt, Arab Rep.El SalvadorEquatorial GuineaEritreaEstoniaEthiopiaEuro areaEurope & Central AsiaEurope & Central Asia (excluding high income)Europe & Central Asia (IDA & IBRD countries)European UnionFijiFinlandFragile and conflict affected situationsFranceFrench PolynesiaGabonGambia, TheGeorgiaGermanyGhanaGreeceGrenadaGuamGuatemalaGuineaGuinea-BissauGuyanaHaitiHeavily indebted poor countries (HIPC)High incomeHondurasHong Kong SAR, ChinaHungaryIBRD onlyIcelandIDA & IBRD totalIDA blendIDA onlyIDA totalIndiaIndonesiaIran, Islamic Rep.IraqIrelandIsraelItalyJamaicaJapanJordanKazakhstanKenyaKiribatiKorea, Dem. People’s Rep.Korea, Rep.KosovoKuwaitKyrgyz RepublicLao PDRLate-demographic dividendLatin America & Caribbean Latin America & Caribbean (excluding high income)Latin America & the Caribbean (IDA & IBRD countries)LatviaLeast developed countries: UN classificationLebanonLesothoLiberiaLibyaLithuaniaLow & middle incomeLow incomeLower middle incomeLuxembourgMacao SAR, ChinaMacedonia, FYRMadagascarMalawiMalaysiaMaldivesMaliMaltaMauritaniaMauritiusMexicoMicronesia, Fed. Sts.Middle East & North AfricaMiddle East & North Africa (excluding high income)Middle East & North Africa (IDA & IBRD countries)Middle incomeMoldovaMongoliaMontenegroMoroccoMozambiqueMyanmarNamibiaNepalNetherlandsNew CaledoniaNew ZealandNicaraguaNigerNigeriaNorth AmericaNorwayOECD membersOmanOther small statesPacific island small statesPakistanPanamaPapua New GuineaParaguayPeruPhilippinesPolandPortugalPost-demographic dividendPre-demographic dividendPuerto RicoQatarRomaniaRussian FederationRwandaSamoaSao Tome and PrincipeSaudi ArabiaSenegalSerbiaSeychellesSierra LeoneSingaporeSlovak RepublicSloveniaSmall statesSolomon IslandsSomaliaSouth AfricaSouth AsiaSouth Asia (IDA & IBRD)South SudanSpainSri LankaSt. LuciaSt. Vincent and the GrenadinesSub-Saharan Africa Sub-Saharan Africa (excluding high income)Sub-Saharan Africa (IDA & IBRD countries)SudanSurinameSwazilandSwedenSwitzerlandSyrian Arab RepublicTajikistanTanzaniaThailandTimor-LesteTogoTongaTrinidad and TobagoTunisiaTurkeyTurkmenistanUgandaUkraineUnited Arab EmiratesUnited KingdomUnited StatesUpper middle incomeUruguayUzbekistanVanuatuVenezuela, RBVietnamVirgin Islands (U.S.)West Bank and GazaWorldYemen, Rep.ZambiaZimbabwe Timeline:
This timeline shows a graph from 1961 to 2016 of IDA only. No data until 1960. Number of actual observations by date: 56.
Source name:
World Development Indicators
Source organization:
World Bank staff estimates based on age distributions of United Nations Population Division's World Population Prospects.
Categories, topics:
Education, Health
Last updated:
apr 23, 2017
Indicators value changes by year
Minimum:
39.611
jan 1, 2016
Maximum:
45.177
jan 1, 1983
At the date of observation
Value
Absolute change
Change from previous value
jan 1, 1961
42.802
+42.802
0.0%
jan 1, 1962
43.122
+0.32
0.75%
jan 1, 1963
43.381
+0.259
0.6%
jan 1, 1964
43.587
+0.206
0.48%
jan 1, 1965
43.744
+0.158
0.36%
jan 1, 1966
43.857
+0.112
0.26%
jan 1, 1967
44.123
+0.266
0.61%
jan 1, 1968
44.312
+0.189
0.43%
jan 1, 1969
44.438
+0.126
0.28%
jan 1, 1970
44.51
+0.072
0.16%
jan 1, 1971
44.53
+0.02
0.05%
jan 1, 1972
44.696
+0.165
0.37%
jan 1, 1973
44.8
+0.104
0.23%
jan 1, 1974
44.855
+0.056
0.12%
jan 1, 1975
44.877
+0.022
0.05%
jan 1, 1976
44.874
-0.003
-0.01%
jan 1, 1977
44.987
+0.113
0.25%
jan 1, 1978
45.047
+0.06
0.13%
jan 1, 1979
45.068
+0.021
0.05%
jan 1, 1980
45.057
-0.011
-0.02%
jan 1, 1981
45.019
-0.038
-0.09%
jan 1, 1982
45.13
+0.112
0.25%
jan 1, 1983
45.177
+0.047
0.1%
jan 1, 1984
45.174
-0.003
-0.01%
jan 1, 1985
45.137
-0.038
-0.08%
jan 1, 1986
45.072
-0.064
-0.14%
jan 1, 1987
45.114
+0.042
0.09%
jan 1, 1988
45.097
-0.018
-0.04%
jan 1, 1989
45.031
-0.065
-0.14%
jan 1, 1990
44.925
-0.107
-0.24%
jan 1, 1991
44.78
-0.144
-0.32%
jan 1, 1992
44.693
-0.087
-0.2%
jan 1, 1993
44.553
-0.14
-0.31%
jan 1, 1994
44.368
-0.184
-0.41%
jan 1, 1995
44.146
-0.223
-0.5%
jan 1, 1996
43.888
-0.258
-0.58%
jan 1, 1997
43.743
-0.145
-0.33%
jan 1, 1998
43.559
-0.184
-0.42%
jan 1, 1999
43.342
-0.217
-0.5%
jan 1, 2000
43.102
-0.24
-0.55%
jan 1, 2001
42.846
-0.256
-0.59%
jan 1, 2002
42.684
-0.162
-0.38%
jan 1, 2003
42.497
-0.187
-0.44%
jan 1, 2004
42.295
-0.202
-0.48%
jan 1, 2005
42.085
-0.21
-0.5%
jan 1, 2006
41.869
-0.216
-0.51%
jan 1, 2007
41.708
-0.161
-0.38%
jan 1, 2008
41.528
-0.18
-0.43%
jan 1, 2009
41.331
-0.197
-0.47%
jan 1, 2010
41.118
-0.213
-0.51%
jan 1, 2011
40.865
-0.253
-0.62%
jan 1, 2012
40.674
-0.191
-0.47%
jan 1, 2013
40.439
-0.235
-0.58%
jan 1, 2014
40.186
-0.253
-0.63%
jan 1, 2015
39.916
-0.269
-0.67%
jan 1, 2016
39.611
-0.306
-0.77%
Ranking of countries by current statistics by years


Comments: