29
/
en
AIzaSyAYiBZKx7MnpbEhh9jyipgxe19OcubqV5w
April 1, 2024
191808
Malta
MLT
true
2
1
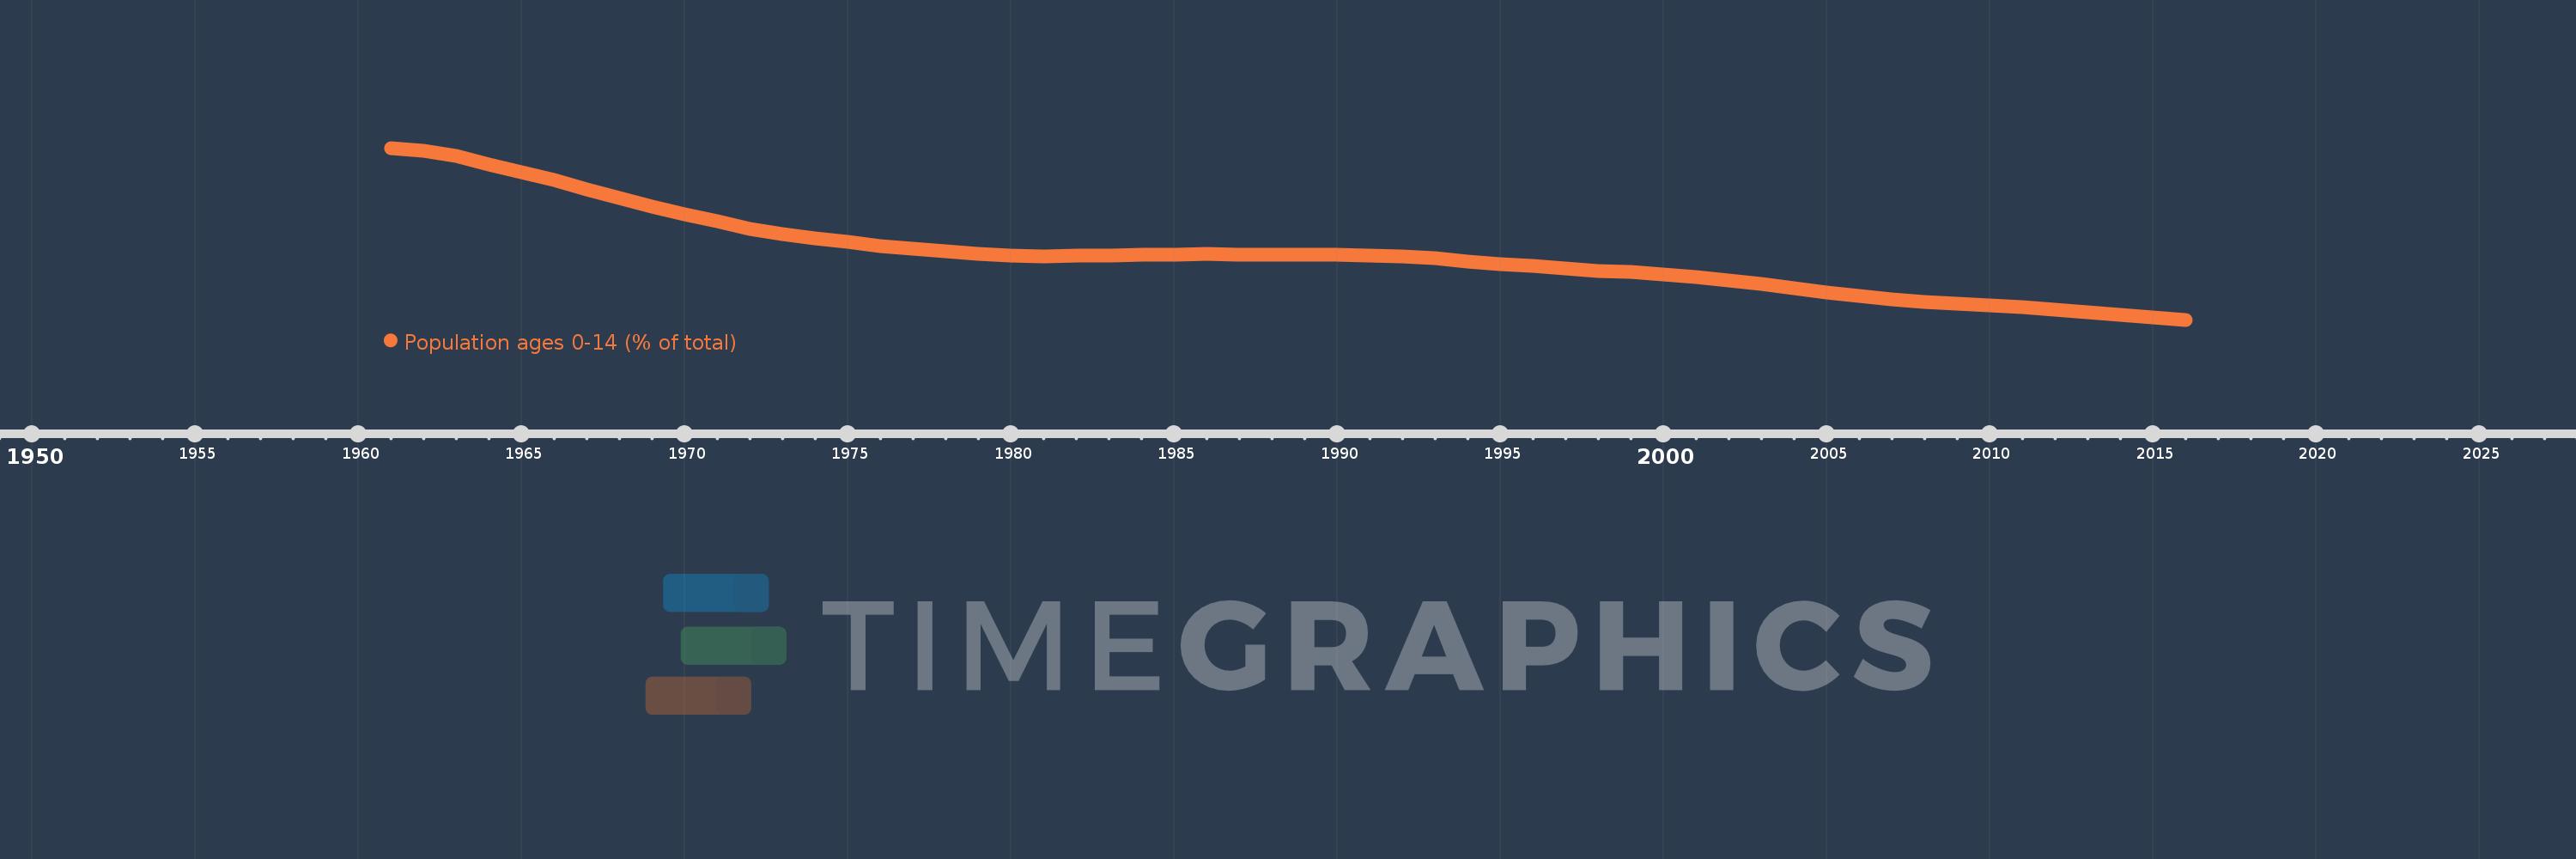
Population ages 0-14 (% of total)
2016,2015,2014,2013,2012,2011,2010,2009,2008,2007,2006,2005,2004,2003,2002,2001,2000,1999,1998,1997,1996,1995,1994,1993,1992,1991,1990,1989,1988,1987,1986,1985,1984,1983,1982,1981,1980,1979,1978,1977,1976,1975,1974,1973,1972,1971,1970,1969,1968,1967,1966,1965,1964,1963,1962,1961
This statistics in other country:
AfghanistanAlbaniaAlgeriaAngolaAntigua and BarbudaArab WorldArgentinaArmeniaArubaAustraliaAustriaAzerbaijanBahamas, TheBahrainBangladeshBarbadosBelarusBelgiumBelizeBeninBhutanBoliviaBosnia and HerzegovinaBotswanaBrazilBrunei DarussalamBulgariaBurkina FasoBurundiCabo VerdeCambodiaCameroonCanadaCaribbean small statesCentral African RepublicCentral Europe and the BalticsChadChannel IslandsChileChinaColombiaComorosCongo, Dem. Rep.Congo, Rep.Costa RicaCote d'IvoireCroatiaCubaCuracaoCyprusCzech RepublicDenmarkDjiboutiDominican RepublicEarly-demographic dividendEast Asia & PacificEast Asia & Pacific (excluding high income)East Asia & Pacific (IDA & IBRD countries)EcuadorEgypt, Arab Rep.El SalvadorEquatorial GuineaEritreaEstoniaEthiopiaEuro areaEurope & Central AsiaEurope & Central Asia (excluding high income)Europe & Central Asia (IDA & IBRD countries)European UnionFijiFinlandFragile and conflict affected situationsFranceFrench PolynesiaGabonGambia, TheGeorgiaGermanyGhanaGreeceGrenadaGuamGuatemalaGuineaGuinea-BissauGuyanaHaitiHeavily indebted poor countries (HIPC)High incomeHondurasHong Kong SAR, ChinaHungaryIBRD onlyIcelandIDA & IBRD totalIDA blendIDA onlyIDA totalIndiaIndonesiaIran, Islamic Rep.IraqIrelandIsraelItalyJamaicaJapanJordanKazakhstanKenyaKiribatiKorea, Dem. People’s Rep.Korea, Rep.KosovoKuwaitKyrgyz RepublicLao PDRLate-demographic dividendLatin America & Caribbean Latin America & Caribbean (excluding high income)Latin America & the Caribbean (IDA & IBRD countries)LatviaLeast developed countries: UN classificationLebanonLesothoLiberiaLibyaLithuaniaLow & middle incomeLow incomeLower middle incomeLuxembourgMacao SAR, ChinaMacedonia, FYRMadagascarMalawiMalaysiaMaldivesMaliMaltaMauritaniaMauritiusMexicoMicronesia, Fed. Sts.Middle East & North AfricaMiddle East & North Africa (excluding high income)Middle East & North Africa (IDA & IBRD countries)Middle incomeMoldovaMongoliaMontenegroMoroccoMozambiqueMyanmarNamibiaNepalNetherlandsNew CaledoniaNew ZealandNicaraguaNigerNigeriaNorth AmericaNorwayOECD membersOmanOther small statesPacific island small statesPakistanPanamaPapua New GuineaParaguayPeruPhilippinesPolandPortugalPost-demographic dividendPre-demographic dividendPuerto RicoQatarRomaniaRussian FederationRwandaSamoaSao Tome and PrincipeSaudi ArabiaSenegalSerbiaSeychellesSierra LeoneSingaporeSlovak RepublicSloveniaSmall statesSolomon IslandsSomaliaSouth AfricaSouth AsiaSouth Asia (IDA & IBRD)South SudanSpainSri LankaSt. LuciaSt. Vincent and the GrenadinesSub-Saharan Africa Sub-Saharan Africa (excluding high income)Sub-Saharan Africa (IDA & IBRD countries)SudanSurinameSwazilandSwedenSwitzerlandSyrian Arab RepublicTajikistanTanzaniaThailandTimor-LesteTogoTongaTrinidad and TobagoTunisiaTurkeyTurkmenistanUgandaUkraineUnited Arab EmiratesUnited KingdomUnited StatesUpper middle incomeUruguayUzbekistanVanuatuVenezuela, RBVietnamVirgin Islands (U.S.)West Bank and GazaWorldYemen, Rep.ZambiaZimbabwe Timeline:
This timeline shows a graph from 1961 to 2016 of Malta. No data until 1960. Number of actual observations by date: 56.
Source name:
World Development Indicators
Source organization:
World Bank staff estimates based on age distributions of United Nations Population Division's World Population Prospects.
Categories, topics:
Education, Health
Last updated:
apr 23, 2017
Indicators value changes by year
Minimum:
14.432
jan 1, 2016
Maximum:
40.282
jan 1, 1961
At the date of observation
Value
Absolute change
Change from previous value
jan 1, 1961
40.282
+40.282
0.0%
jan 1, 1962
39.907
-0.375
-0.93%
jan 1, 1963
39.04
-0.867
-2.17%
jan 1, 1964
37.829
-1.211
-3.1%
jan 1, 1965
36.578
-1.25
-3.31%
jan 1, 1966
35.463
-1.116
-3.05%
jan 1, 1967
34.034
-1.428
-4.03%
jan 1, 1968
32.698
-1.336
-3.93%
jan 1, 1969
31.46
-1.238
-3.79%
jan 1, 1970
30.304
-1.156
-3.68%
jan 1, 1971
29.235
-1.069
-3.53%
jan 1, 1972
28.154
-1.081
-3.7%
jan 1, 1973
27.338
-0.816
-2.9%
jan 1, 1974
26.691
-0.647
-2.37%
jan 1, 1975
26.099
-0.592
-2.22%
jan 1, 1976
25.528
-0.571
-2.19%
jan 1, 1977
25.179
-0.348
-1.37%
jan 1, 1978
24.762
-0.418
-1.66%
jan 1, 1979
24.364
-0.398
-1.61%
jan 1, 1980
24.105
-0.258
-1.06%
jan 1, 1981
24.019
-0.086
-0.36%
jan 1, 1982
24.039
+0.02
0.08%
jan 1, 1983
24.084
+0.045
0.19%
jan 1, 1984
24.155
+0.071
0.29%
jan 1, 1985
24.234
+0.079
0.33%
jan 1, 1986
24.307
+0.074
0.3%
jan 1, 1987
24.206
-0.102
-0.42%
jan 1, 1988
24.227
+0.021
0.09%
jan 1, 1989
24.273
+0.046
0.19%
jan 1, 1990
24.224
-0.049
-0.2%
jan 1, 1991
24.036
-0.189
-0.78%
jan 1, 1992
23.944
-0.092
-0.38%
jan 1, 1993
23.644
-0.3
-1.25%
jan 1, 1994
23.222
-0.422
-1.79%
jan 1, 1995
22.815
-0.407
-1.75%
jan 1, 1996
22.486
-0.329
-1.44%
jan 1, 1997
22.102
-0.384
-1.71%
jan 1, 1998
21.816
-0.287
-1.3%
jan 1, 1999
21.575
-0.241
-1.1%
jan 1, 2000
21.282
-0.294
-1.36%
jan 1, 2001
20.882
-0.399
-1.88%
jan 1, 2002
20.373
-0.51
-2.44%
jan 1, 2003
19.772
-0.601
-2.95%
jan 1, 2004
19.118
-0.654
-3.31%
jan 1, 2005
18.495
-0.622
-3.25%
jan 1, 2006
17.965
-0.531
-2.87%
jan 1, 2007
17.492
-0.472
-2.63%
jan 1, 2008
17.142
-0.35
-2.0%
jan 1, 2009
16.864
-0.278
-1.62%
jan 1, 2010
16.596
-0.268
-1.59%
jan 1, 2011
16.304
-0.292
-1.76%
jan 1, 2012
15.922
-0.382
-2.34%
jan 1, 2013
15.527
-0.396
-2.48%
jan 1, 2014
15.126
-0.401
-2.58%
jan 1, 2015
14.753
-0.373
-2.47%
jan 1, 2016
14.432
-0.32
-2.17%
Ranking of countries by current statistics by years


Comments: