29
/
en
AIzaSyAYiBZKx7MnpbEhh9jyipgxe19OcubqV5w
April 1, 2024
102874
Central African Republic
CAF
true
2
1
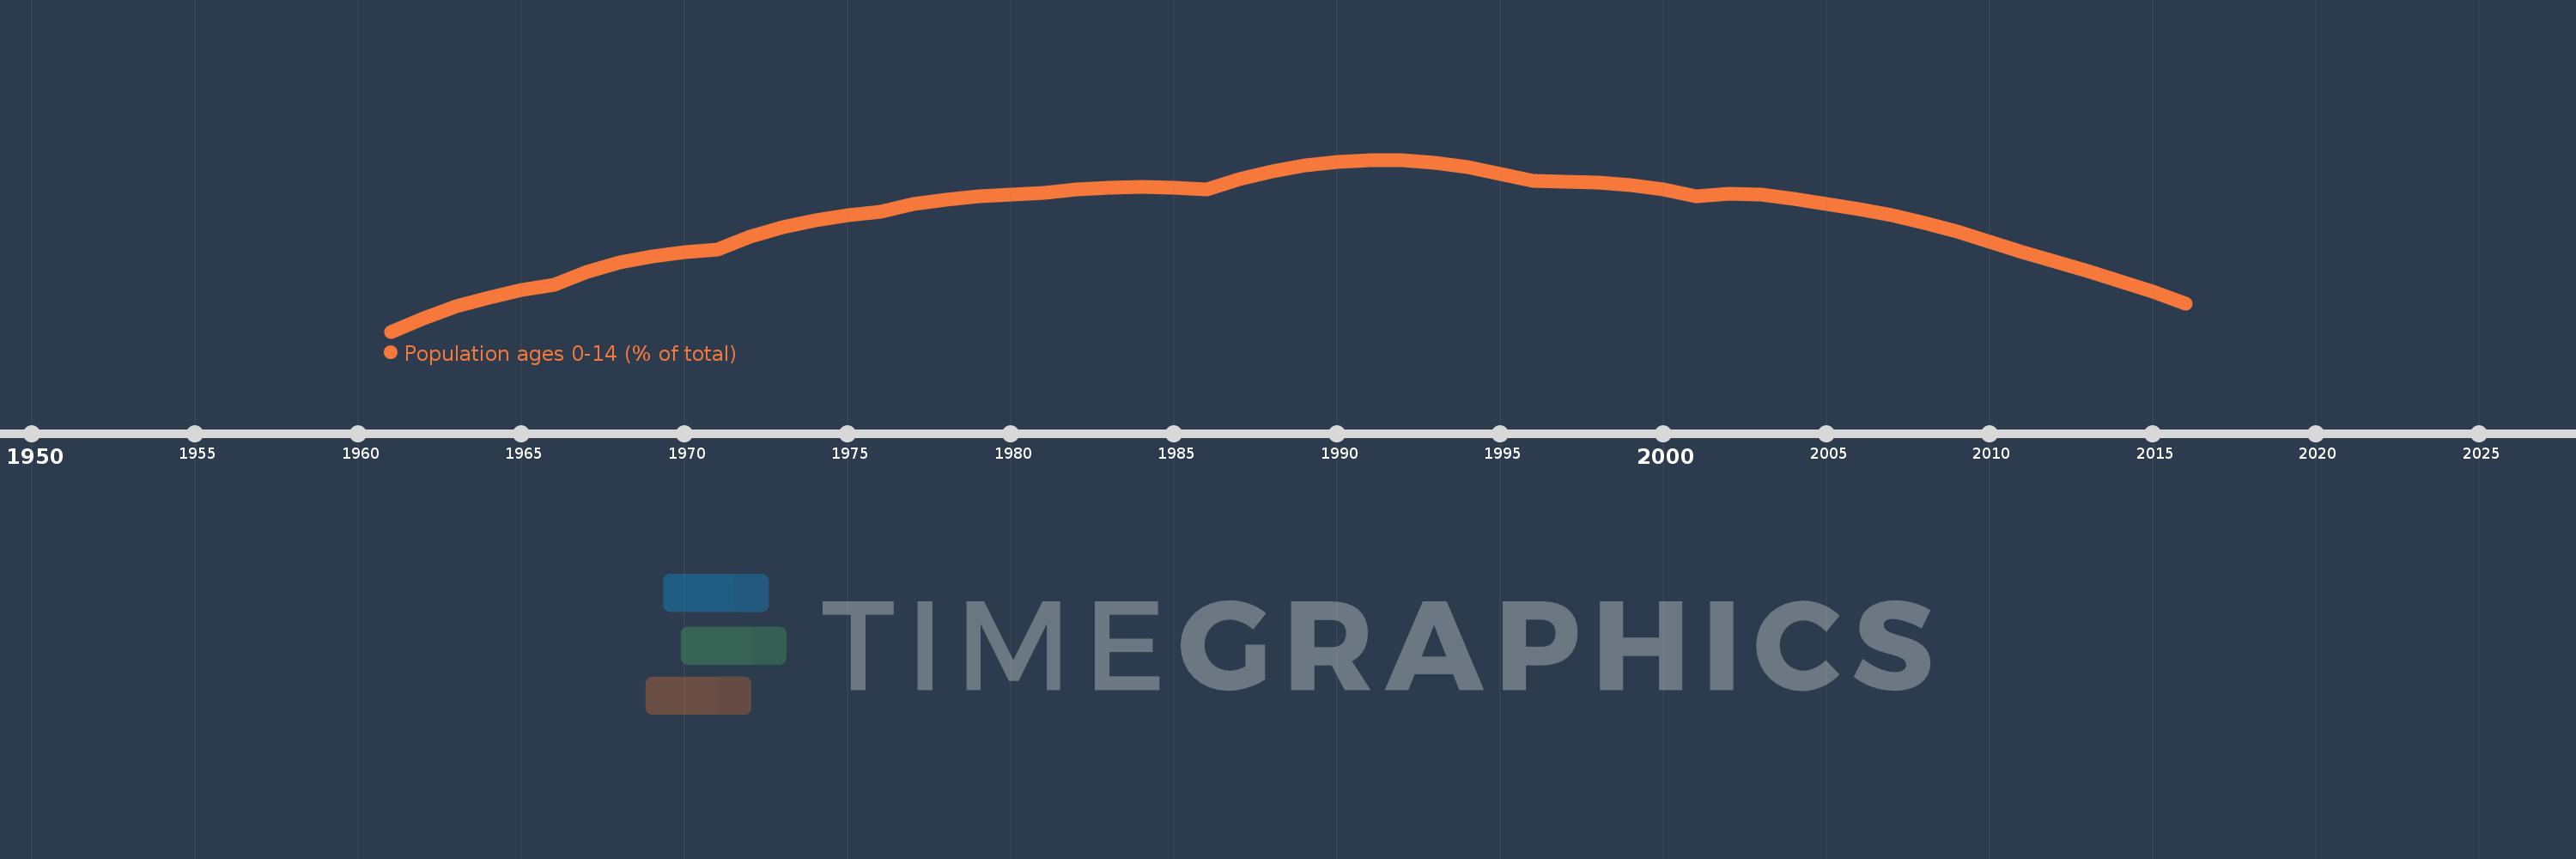
Population ages 0-14 (% of total)
2016,2015,2014,2013,2012,2011,2010,2009,2008,2007,2006,2005,2004,2003,2002,2001,2000,1999,1998,1997,1996,1995,1994,1993,1992,1991,1990,1989,1988,1987,1986,1985,1984,1983,1982,1981,1980,1979,1978,1977,1976,1975,1974,1973,1972,1971,1970,1969,1968,1967,1966,1965,1964,1963,1962,1961
This statistics in other country:
AfghanistanAlbaniaAlgeriaAngolaAntigua and BarbudaArab WorldArgentinaArmeniaArubaAustraliaAustriaAzerbaijanBahamas, TheBahrainBangladeshBarbadosBelarusBelgiumBelizeBeninBhutanBoliviaBosnia and HerzegovinaBotswanaBrazilBrunei DarussalamBulgariaBurkina FasoBurundiCabo VerdeCambodiaCameroonCanadaCaribbean small statesCentral African RepublicCentral Europe and the BalticsChadChannel IslandsChileChinaColombiaComorosCongo, Dem. Rep.Congo, Rep.Costa RicaCote d'IvoireCroatiaCubaCuracaoCyprusCzech RepublicDenmarkDjiboutiDominican RepublicEarly-demographic dividendEast Asia & PacificEast Asia & Pacific (excluding high income)East Asia & Pacific (IDA & IBRD countries)EcuadorEgypt, Arab Rep.El SalvadorEquatorial GuineaEritreaEstoniaEthiopiaEuro areaEurope & Central AsiaEurope & Central Asia (excluding high income)Europe & Central Asia (IDA & IBRD countries)European UnionFijiFinlandFragile and conflict affected situationsFranceFrench PolynesiaGabonGambia, TheGeorgiaGermanyGhanaGreeceGrenadaGuamGuatemalaGuineaGuinea-BissauGuyanaHaitiHeavily indebted poor countries (HIPC)High incomeHondurasHong Kong SAR, ChinaHungaryIBRD onlyIcelandIDA & IBRD totalIDA blendIDA onlyIDA totalIndiaIndonesiaIran, Islamic Rep.IraqIrelandIsraelItalyJamaicaJapanJordanKazakhstanKenyaKiribatiKorea, Dem. People’s Rep.Korea, Rep.KosovoKuwaitKyrgyz RepublicLao PDRLate-demographic dividendLatin America & Caribbean Latin America & Caribbean (excluding high income)Latin America & the Caribbean (IDA & IBRD countries)LatviaLeast developed countries: UN classificationLebanonLesothoLiberiaLibyaLithuaniaLow & middle incomeLow incomeLower middle incomeLuxembourgMacao SAR, ChinaMacedonia, FYRMadagascarMalawiMalaysiaMaldivesMaliMaltaMauritaniaMauritiusMexicoMicronesia, Fed. Sts.Middle East & North AfricaMiddle East & North Africa (excluding high income)Middle East & North Africa (IDA & IBRD countries)Middle incomeMoldovaMongoliaMontenegroMoroccoMozambiqueMyanmarNamibiaNepalNetherlandsNew CaledoniaNew ZealandNicaraguaNigerNigeriaNorth AmericaNorwayOECD membersOmanOther small statesPacific island small statesPakistanPanamaPapua New GuineaParaguayPeruPhilippinesPolandPortugalPost-demographic dividendPre-demographic dividendPuerto RicoQatarRomaniaRussian FederationRwandaSamoaSao Tome and PrincipeSaudi ArabiaSenegalSerbiaSeychellesSierra LeoneSingaporeSlovak RepublicSloveniaSmall statesSolomon IslandsSomaliaSouth AfricaSouth AsiaSouth Asia (IDA & IBRD)South SudanSpainSri LankaSt. LuciaSt. Vincent and the GrenadinesSub-Saharan Africa Sub-Saharan Africa (excluding high income)Sub-Saharan Africa (IDA & IBRD countries)SudanSurinameSwazilandSwedenSwitzerlandSyrian Arab RepublicTajikistanTanzaniaThailandTimor-LesteTogoTongaTrinidad and TobagoTunisiaTurkeyTurkmenistanUgandaUkraineUnited Arab EmiratesUnited KingdomUnited StatesUpper middle incomeUruguayUzbekistanVanuatuVenezuela, RBVietnamVirgin Islands (U.S.)West Bank and GazaWorldYemen, Rep.ZambiaZimbabwe Timeline:
This timeline shows a graph from 1961 to 2016 of Central African Republic. No data until 1960. Number of actual observations by date: 56.
Source name:
World Development Indicators
Source organization:
World Bank staff estimates based on age distributions of United Nations Population Division's World Population Prospects.
Categories, topics:
Education, Health
Last updated:
apr 23, 2017
Indicators value changes by year
Minimum:
38.244
jan 1, 1961
Maximum:
43.186
jan 1, 1992
At the date of observation
Value
Absolute change
Change from previous value
jan 1, 1961
38.244
+38.244
0.0%
jan 1, 1962
38.638
+0.394
1.03%
jan 1, 1963
38.961
+0.323
0.84%
jan 1, 1964
39.228
+0.267
0.68%
jan 1, 1965
39.441
+0.213
0.54%
jan 1, 1966
39.603
+0.162
0.41%
jan 1, 1967
39.962
+0.359
0.91%
jan 1, 1968
40.226
+0.264
0.66%
jan 1, 1969
40.413
+0.188
0.47%
jan 1, 1970
40.539
+0.125
0.31%
jan 1, 1971
40.611
+0.072
0.18%
jan 1, 1972
40.97
+0.359
0.88%
jan 1, 1973
41.237
+0.268
0.65%
jan 1, 1974
41.434
+0.197
0.48%
jan 1, 1975
41.582
+0.148
0.36%
jan 1, 1976
41.697
+0.115
0.28%
jan 1, 1977
41.907
+0.209
0.5%
jan 1, 1978
42.044
+0.138
0.33%
jan 1, 1979
42.133
+0.088
0.21%
jan 1, 1980
42.195
+0.062
0.15%
jan 1, 1981
42.245
+0.051
0.12%
jan 1, 1982
42.333
+0.088
0.21%
jan 1, 1983
42.383
+0.05
0.12%
jan 1, 1984
42.404
+0.021
0.05%
jan 1, 1985
42.393
-0.011
-0.03%
jan 1, 1986
42.343
-0.05
-0.12%
jan 1, 1987
42.633
+0.29
0.69%
jan 1, 1988
42.855
+0.222
0.52%
jan 1, 1989
43.015
+0.16
0.37%
jan 1, 1990
43.119
+0.104
0.24%
jan 1, 1991
43.173
+0.054
0.12%
jan 1, 1992
43.186
+0.013
0.03%
jan 1, 1993
43.108
-0.078
-0.18%
jan 1, 1994
42.964
-0.144
-0.34%
jan 1, 1995
42.781
-0.183
-0.43%
jan 1, 1996
42.575
-0.206
-0.48%
jan 1, 1997
42.553
-0.022
-0.05%
jan 1, 1998
42.519
-0.034
-0.08%
jan 1, 1999
42.453
-0.066
-0.15%
jan 1, 2000
42.326
-0.128
-0.3%
jan 1, 2001
42.124
-0.202
-0.48%
jan 1, 2002
42.208
+0.084
0.2%
jan 1, 2003
42.178
-0.03
-0.07%
jan 1, 2004
42.066
-0.111
-0.26%
jan 1, 2005
41.918
-0.148
-0.35%
jan 1, 2006
41.754
-0.165
-0.39%
jan 1, 2007
41.584
-0.17
-0.41%
jan 1, 2008
41.368
-0.216
-0.52%
jan 1, 2009
41.116
-0.252
-0.61%
jan 1, 2010
40.833
-0.283
-0.69%
jan 1, 2011
40.526
-0.307
-0.75%
jan 1, 2012
40.252
-0.274
-0.68%
jan 1, 2013
39.977
-0.274
-0.68%
jan 1, 2014
39.695
-0.282
-0.71%
jan 1, 2015
39.388
-0.307
-0.77%
jan 1, 2016
39.053
-0.336
-0.85%
Ranking of countries by current statistics by years


Comments: