29
/
en
AIzaSyAYiBZKx7MnpbEhh9jyipgxe19OcubqV5w
April 1, 2024
44575
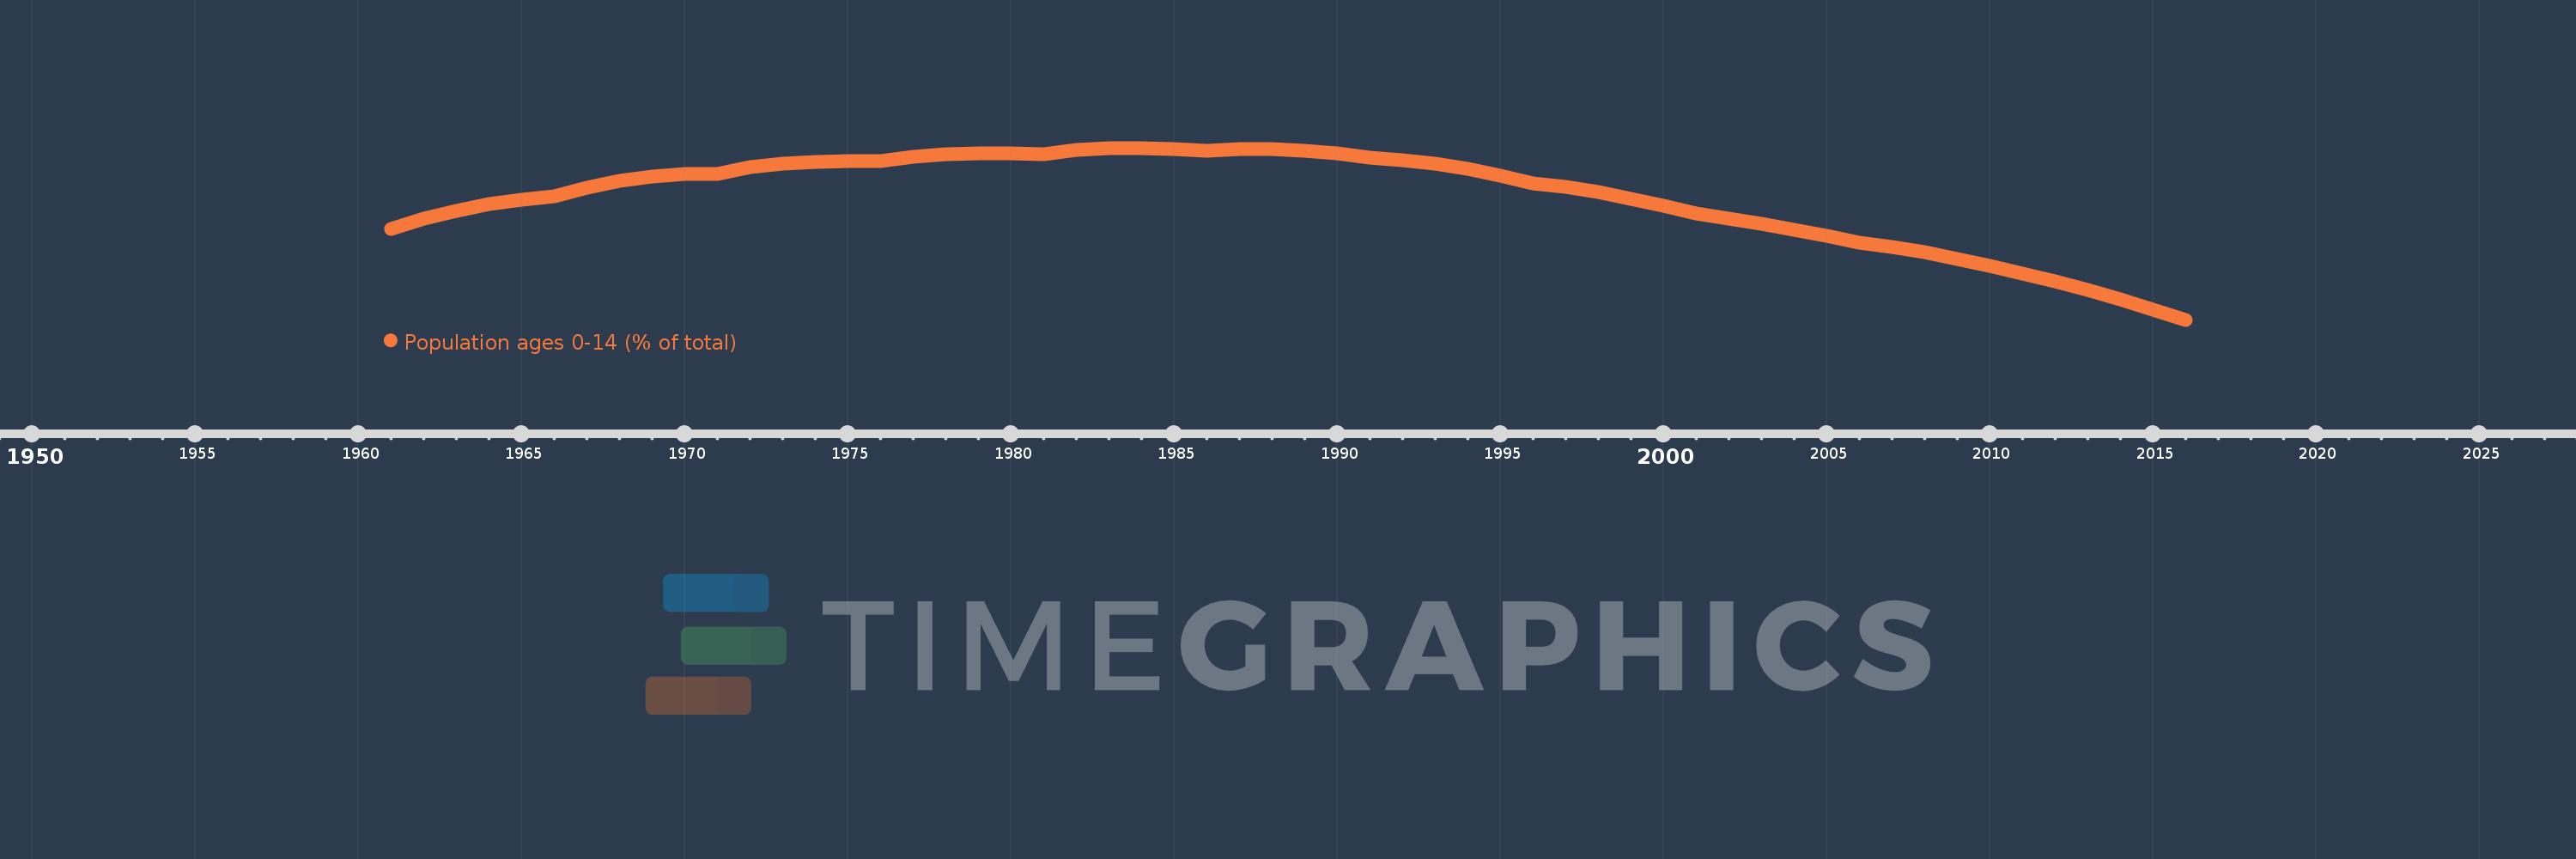
Least developed countries: UN classification
LDC
false
2
1
Population ages 0-14 (% of total)
2016,2015,2014,2013,2012,2011,2010,2009,2008,2007,2006,2005,2004,2003,2002,2001,2000,1999,1998,1997,1996,1995,1994,1993,1992,1991,1990,1989,1988,1987,1986,1985,1984,1983,1982,1981,1980,1979,1978,1977,1976,1975,1974,1973,1972,1971,1970,1969,1968,1967,1966,1965,1964,1963,1962,1961
This statistics in other country:
AfghanistanAlbaniaAlgeriaAngolaAntigua and BarbudaArab WorldArgentinaArmeniaArubaAustraliaAustriaAzerbaijanBahamas, TheBahrainBangladeshBarbadosBelarusBelgiumBelizeBeninBhutanBoliviaBosnia and HerzegovinaBotswanaBrazilBrunei DarussalamBulgariaBurkina FasoBurundiCabo VerdeCambodiaCameroonCanadaCaribbean small statesCentral African RepublicCentral Europe and the BalticsChadChannel IslandsChileChinaColombiaComorosCongo, Dem. Rep.Congo, Rep.Costa RicaCote d'IvoireCroatiaCubaCuracaoCyprusCzech RepublicDenmarkDjiboutiDominican RepublicEarly-demographic dividendEast Asia & PacificEast Asia & Pacific (excluding high income)East Asia & Pacific (IDA & IBRD countries)EcuadorEgypt, Arab Rep.El SalvadorEquatorial GuineaEritreaEstoniaEthiopiaEuro areaEurope & Central AsiaEurope & Central Asia (excluding high income)Europe & Central Asia (IDA & IBRD countries)European UnionFijiFinlandFragile and conflict affected situationsFranceFrench PolynesiaGabonGambia, TheGeorgiaGermanyGhanaGreeceGrenadaGuamGuatemalaGuineaGuinea-BissauGuyanaHaitiHeavily indebted poor countries (HIPC)High incomeHondurasHong Kong SAR, ChinaHungaryIBRD onlyIcelandIDA & IBRD totalIDA blendIDA onlyIDA totalIndiaIndonesiaIran, Islamic Rep.IraqIrelandIsraelItalyJamaicaJapanJordanKazakhstanKenyaKiribatiKorea, Dem. People’s Rep.Korea, Rep.KosovoKuwaitKyrgyz RepublicLao PDRLate-demographic dividendLatin America & Caribbean Latin America & Caribbean (excluding high income)Latin America & the Caribbean (IDA & IBRD countries)LatviaLeast developed countries: UN classificationLebanonLesothoLiberiaLibyaLithuaniaLow & middle incomeLow incomeLower middle incomeLuxembourgMacao SAR, ChinaMacedonia, FYRMadagascarMalawiMalaysiaMaldivesMaliMaltaMauritaniaMauritiusMexicoMicronesia, Fed. Sts.Middle East & North AfricaMiddle East & North Africa (excluding high income)Middle East & North Africa (IDA & IBRD countries)Middle incomeMoldovaMongoliaMontenegroMoroccoMozambiqueMyanmarNamibiaNepalNetherlandsNew CaledoniaNew ZealandNicaraguaNigerNigeriaNorth AmericaNorwayOECD membersOmanOther small statesPacific island small statesPakistanPanamaPapua New GuineaParaguayPeruPhilippinesPolandPortugalPost-demographic dividendPre-demographic dividendPuerto RicoQatarRomaniaRussian FederationRwandaSamoaSao Tome and PrincipeSaudi ArabiaSenegalSerbiaSeychellesSierra LeoneSingaporeSlovak RepublicSloveniaSmall statesSolomon IslandsSomaliaSouth AfricaSouth AsiaSouth Asia (IDA & IBRD)South SudanSpainSri LankaSt. LuciaSt. Vincent and the GrenadinesSub-Saharan Africa Sub-Saharan Africa (excluding high income)Sub-Saharan Africa (IDA & IBRD countries)SudanSurinameSwazilandSwedenSwitzerlandSyrian Arab RepublicTajikistanTanzaniaThailandTimor-LesteTogoTongaTrinidad and TobagoTunisiaTurkeyTurkmenistanUgandaUkraineUnited Arab EmiratesUnited KingdomUnited StatesUpper middle incomeUruguayUzbekistanVanuatuVenezuela, RBVietnamVirgin Islands (U.S.)West Bank and GazaWorldYemen, Rep.ZambiaZimbabwe Timeline:
This timeline shows a graph from 1961 to 2016 of Least developed countries: UN classification. No data until 1960. Number of actual observations by date: 56.
Source name:
World Development Indicators
Source organization:
World Bank staff estimates based on age distributions of United Nations Population Division's World Population Prospects.
Categories, topics:
Education, Health
Last updated:
apr 23, 2017
Indicators value changes by year
Minimum:
39.979
jan 1, 2016
Maximum:
44.985
jan 1, 1984
At the date of observation
Value
Absolute change
Change from previous value
jan 1, 1961
42.632
+42.632
0.0%
jan 1, 1962
42.927
+0.294
0.69%
jan 1, 1963
43.159
+0.233
0.54%
jan 1, 1964
43.342
+0.182
0.42%
jan 1, 1965
43.478
+0.137
0.32%
jan 1, 1966
43.574
+0.096
0.22%
jan 1, 1967
43.836
+0.262
0.6%
jan 1, 1968
44.024
+0.188
0.43%
jan 1, 1969
44.151
+0.128
0.29%
jan 1, 1970
44.223
+0.072
0.16%
jan 1, 1971
44.239
+0.015
0.03%
jan 1, 1972
44.417
+0.179
0.4%
jan 1, 1973
44.527
+0.109
0.25%
jan 1, 1974
44.583
+0.056
0.13%
jan 1, 1975
44.606
+0.023
0.05%
jan 1, 1976
44.607
+0.001
0.0%
jan 1, 1977
44.728
+0.121
0.27%
jan 1, 1978
44.798
+0.07
0.16%
jan 1, 1979
44.831
+0.033
0.07%
jan 1, 1980
44.829
-0.002
0.0%
jan 1, 1981
44.795
-0.034
-0.08%
jan 1, 1982
44.924
+0.129
0.29%
jan 1, 1983
44.981
+0.057
0.13%
jan 1, 1984
44.985
+0.004
0.01%
jan 1, 1985
44.953
-0.031
-0.07%
jan 1, 1986
44.898
-0.056
-0.12%
jan 1, 1987
44.956
+0.059
0.13%
jan 1, 1988
44.954
-0.002
0.0%
jan 1, 1989
44.904
-0.05
-0.11%
jan 1, 1990
44.815
-0.089
-0.2%
jan 1, 1991
44.692
-0.123
-0.28%
jan 1, 1992
44.632
-0.06
-0.13%
jan 1, 1993
44.523
-0.109
-0.24%
jan 1, 1994
44.371
-0.151
-0.34%
jan 1, 1995
44.18
-0.191
-0.43%
jan 1, 1996
43.951
-0.229
-0.52%
jan 1, 1997
43.847
-0.104
-0.24%
jan 1, 1998
43.695
-0.152
-0.35%
jan 1, 1999
43.506
-0.189
-0.43%
jan 1, 2000
43.294
-0.212
-0.49%
jan 1, 2001
43.069
-0.224
-0.52%
jan 1, 2002
42.935
-0.135
-0.31%
jan 1, 2003
42.777
-0.158
-0.37%
jan 1, 2004
42.605
-0.172
-0.4%
jan 1, 2005
42.421
-0.184
-0.43%
jan 1, 2006
42.224
-0.198
-0.47%
jan 1, 2007
42.094
-0.129
-0.31%
jan 1, 2008
41.937
-0.157
-0.37%
jan 1, 2009
41.756
-0.181
-0.43%
jan 1, 2010
41.555
-0.201
-0.48%
jan 1, 2011
41.335
-0.22
-0.53%
jan 1, 2012
41.102
-0.233
-0.56%
jan 1, 2013
40.847
-0.256
-0.62%
jan 1, 2014
40.572
-0.275
-0.67%
jan 1, 2015
40.282
-0.29
-0.72%
jan 1, 2016
39.979
-0.303
-0.75%
Ranking of countries by current statistics by years


Comments: