29
/
en
AIzaSyAYiBZKx7MnpbEhh9jyipgxe19OcubqV5w
April 1, 2024
213451
Nigeria
NGA
true
2
1
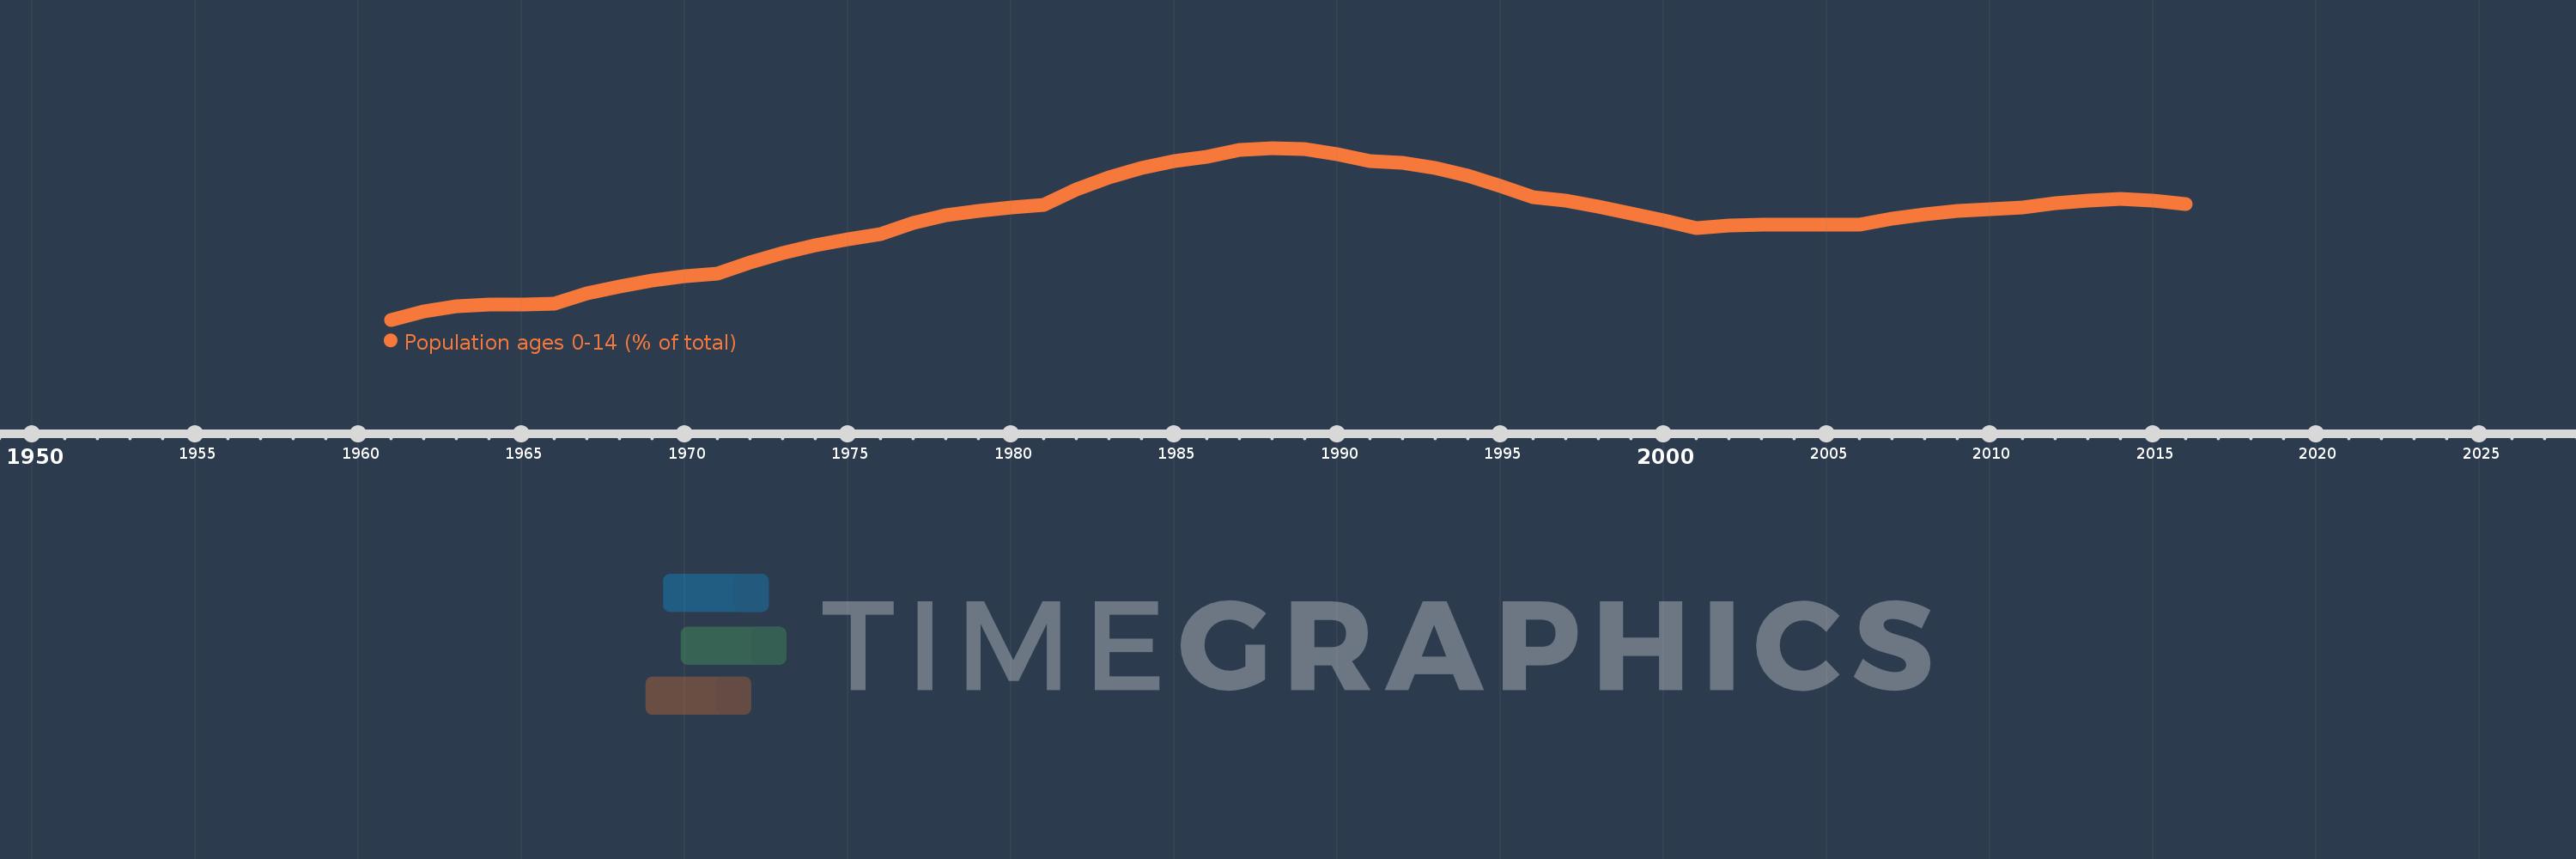
Population ages 0-14 (% of total)
2016,2015,2014,2013,2012,2011,2010,2009,2008,2007,2006,2005,2004,2003,2002,2001,2000,1999,1998,1997,1996,1995,1994,1993,1992,1991,1990,1989,1988,1987,1986,1985,1984,1983,1982,1981,1980,1979,1978,1977,1976,1975,1974,1973,1972,1971,1970,1969,1968,1967,1966,1965,1964,1963,1962,1961
This statistics in other country:
AfghanistanAlbaniaAlgeriaAngolaAntigua and BarbudaArab WorldArgentinaArmeniaArubaAustraliaAustriaAzerbaijanBahamas, TheBahrainBangladeshBarbadosBelarusBelgiumBelizeBeninBhutanBoliviaBosnia and HerzegovinaBotswanaBrazilBrunei DarussalamBulgariaBurkina FasoBurundiCabo VerdeCambodiaCameroonCanadaCaribbean small statesCentral African RepublicCentral Europe and the BalticsChadChannel IslandsChileChinaColombiaComorosCongo, Dem. Rep.Congo, Rep.Costa RicaCote d'IvoireCroatiaCubaCuracaoCyprusCzech RepublicDenmarkDjiboutiDominican RepublicEarly-demographic dividendEast Asia & PacificEast Asia & Pacific (excluding high income)East Asia & Pacific (IDA & IBRD countries)EcuadorEgypt, Arab Rep.El SalvadorEquatorial GuineaEritreaEstoniaEthiopiaEuro areaEurope & Central AsiaEurope & Central Asia (excluding high income)Europe & Central Asia (IDA & IBRD countries)European UnionFijiFinlandFragile and conflict affected situationsFranceFrench PolynesiaGabonGambia, TheGeorgiaGermanyGhanaGreeceGrenadaGuamGuatemalaGuineaGuinea-BissauGuyanaHaitiHeavily indebted poor countries (HIPC)High incomeHondurasHong Kong SAR, ChinaHungaryIBRD onlyIcelandIDA & IBRD totalIDA blendIDA onlyIDA totalIndiaIndonesiaIran, Islamic Rep.IraqIrelandIsraelItalyJamaicaJapanJordanKazakhstanKenyaKiribatiKorea, Dem. People’s Rep.Korea, Rep.KosovoKuwaitKyrgyz RepublicLao PDRLate-demographic dividendLatin America & Caribbean Latin America & Caribbean (excluding high income)Latin America & the Caribbean (IDA & IBRD countries)LatviaLeast developed countries: UN classificationLebanonLesothoLiberiaLibyaLithuaniaLow & middle incomeLow incomeLower middle incomeLuxembourgMacao SAR, ChinaMacedonia, FYRMadagascarMalawiMalaysiaMaldivesMaliMaltaMauritaniaMauritiusMexicoMicronesia, Fed. Sts.Middle East & North AfricaMiddle East & North Africa (excluding high income)Middle East & North Africa (IDA & IBRD countries)Middle incomeMoldovaMongoliaMontenegroMoroccoMozambiqueMyanmarNamibiaNepalNetherlandsNew CaledoniaNew ZealandNicaraguaNigerNigeriaNorth AmericaNorwayOECD membersOmanOther small statesPacific island small statesPakistanPanamaPapua New GuineaParaguayPeruPhilippinesPolandPortugalPost-demographic dividendPre-demographic dividendPuerto RicoQatarRomaniaRussian FederationRwandaSamoaSao Tome and PrincipeSaudi ArabiaSenegalSerbiaSeychellesSierra LeoneSingaporeSlovak RepublicSloveniaSmall statesSolomon IslandsSomaliaSouth AfricaSouth AsiaSouth Asia (IDA & IBRD)South SudanSpainSri LankaSt. LuciaSt. Vincent and the GrenadinesSub-Saharan Africa Sub-Saharan Africa (excluding high income)Sub-Saharan Africa (IDA & IBRD countries)SudanSurinameSwazilandSwedenSwitzerlandSyrian Arab RepublicTajikistanTanzaniaThailandTimor-LesteTogoTongaTrinidad and TobagoTunisiaTurkeyTurkmenistanUgandaUkraineUnited Arab EmiratesUnited KingdomUnited StatesUpper middle incomeUruguayUzbekistanVanuatuVenezuela, RBVietnamVirgin Islands (U.S.)West Bank and GazaWorldYemen, Rep.ZambiaZimbabwe Timeline:
This timeline shows a graph from 1961 to 2016 of Nigeria. No data until 1960. Number of actual observations by date: 56.
Source name:
World Development Indicators
Source organization:
World Bank staff estimates based on age distributions of United Nations Population Division's World Population Prospects.
Categories, topics:
Education, Health
Last updated:
apr 23, 2017
Indicators value changes by year
Minimum:
41.619
jan 1, 1961
Maximum:
45.143
jan 1, 1988
At the date of observation
Value
Absolute change
Change from previous value
jan 1, 1961
41.619
+41.619
0.0%
jan 1, 1962
41.798
+0.18
0.43%
jan 1, 1963
41.888
+0.09
0.21%
jan 1, 1964
41.923
+0.035
0.08%
jan 1, 1965
41.936
+0.013
0.03%
jan 1, 1966
41.942
+0.006
0.01%
jan 1, 1967
42.153
+0.211
0.5%
jan 1, 1968
42.309
+0.156
0.37%
jan 1, 1969
42.423
+0.115
0.27%
jan 1, 1970
42.508
+0.085
0.2%
jan 1, 1971
42.573
+0.064
0.15%
jan 1, 1972
42.795
+0.223
0.52%
jan 1, 1973
42.985
+0.19
0.44%
jan 1, 1974
43.143
+0.158
0.37%
jan 1, 1975
43.269
+0.126
0.29%
jan 1, 1976
43.369
+0.1
0.23%
jan 1, 1977
43.604
+0.235
0.54%
jan 1, 1978
43.757
+0.153
0.35%
jan 1, 1979
43.856
+0.099
0.23%
jan 1, 1980
43.928
+0.072
0.16%
jan 1, 1981
43.979
+0.051
0.12%
jan 1, 1982
44.287
+0.308
0.7%
jan 1, 1983
44.541
+0.254
0.57%
jan 1, 1984
44.741
+0.2
0.45%
jan 1, 1985
44.88
+0.139
0.31%
jan 1, 1986
44.953
+0.073
0.16%
jan 1, 1987
45.094
+0.141
0.31%
jan 1, 1988
45.143
+0.049
0.11%
jan 1, 1989
45.115
-0.029
-0.06%
jan 1, 1990
45.022
-0.092
-0.2%
jan 1, 1991
44.876
-0.147
-0.33%
jan 1, 1992
44.834
-0.041
-0.09%
jan 1, 1993
44.729
-0.106
-0.24%
jan 1, 1994
44.569
-0.16
-0.36%
jan 1, 1995
44.367
-0.202
-0.45%
jan 1, 1996
44.136
-0.231
-0.52%
jan 1, 1997
44.064
-0.071
-0.16%
jan 1, 1998
43.948
-0.116
-0.26%
jan 1, 1999
43.804
-0.144
-0.33%
jan 1, 2000
43.651
-0.153
-0.35%
jan 1, 2001
43.504
-0.147
-0.34%
jan 1, 2002
43.544
+0.041
0.09%
jan 1, 2003
43.564
+0.02
0.05%
jan 1, 2004
43.572
+0.008
0.02%
jan 1, 2005
43.573
+0.001
0.0%
jan 1, 2006
43.572
-0.001
0.0%
jan 1, 2007
43.699
+0.127
0.29%
jan 1, 2008
43.788
+0.089
0.2%
jan 1, 2009
43.85
+0.061
0.14%
jan 1, 2010
43.893
+0.044
0.1%
jan 1, 2011
43.923
+0.03
0.07%
jan 1, 2012
44.009
+0.085
0.19%
jan 1, 2013
44.07
+0.061
0.14%
jan 1, 2014
44.096
+0.026
0.06%
jan 1, 2015
44.071
-0.025
-0.06%
jan 1, 2016
43.989
-0.082
-0.19%
Ranking of countries by current statistics by years


Comments: