29
/
en
AIzaSyAYiBZKx7MnpbEhh9jyipgxe19OcubqV5w
April 1, 2024
106438
China
CHN
true
2
1
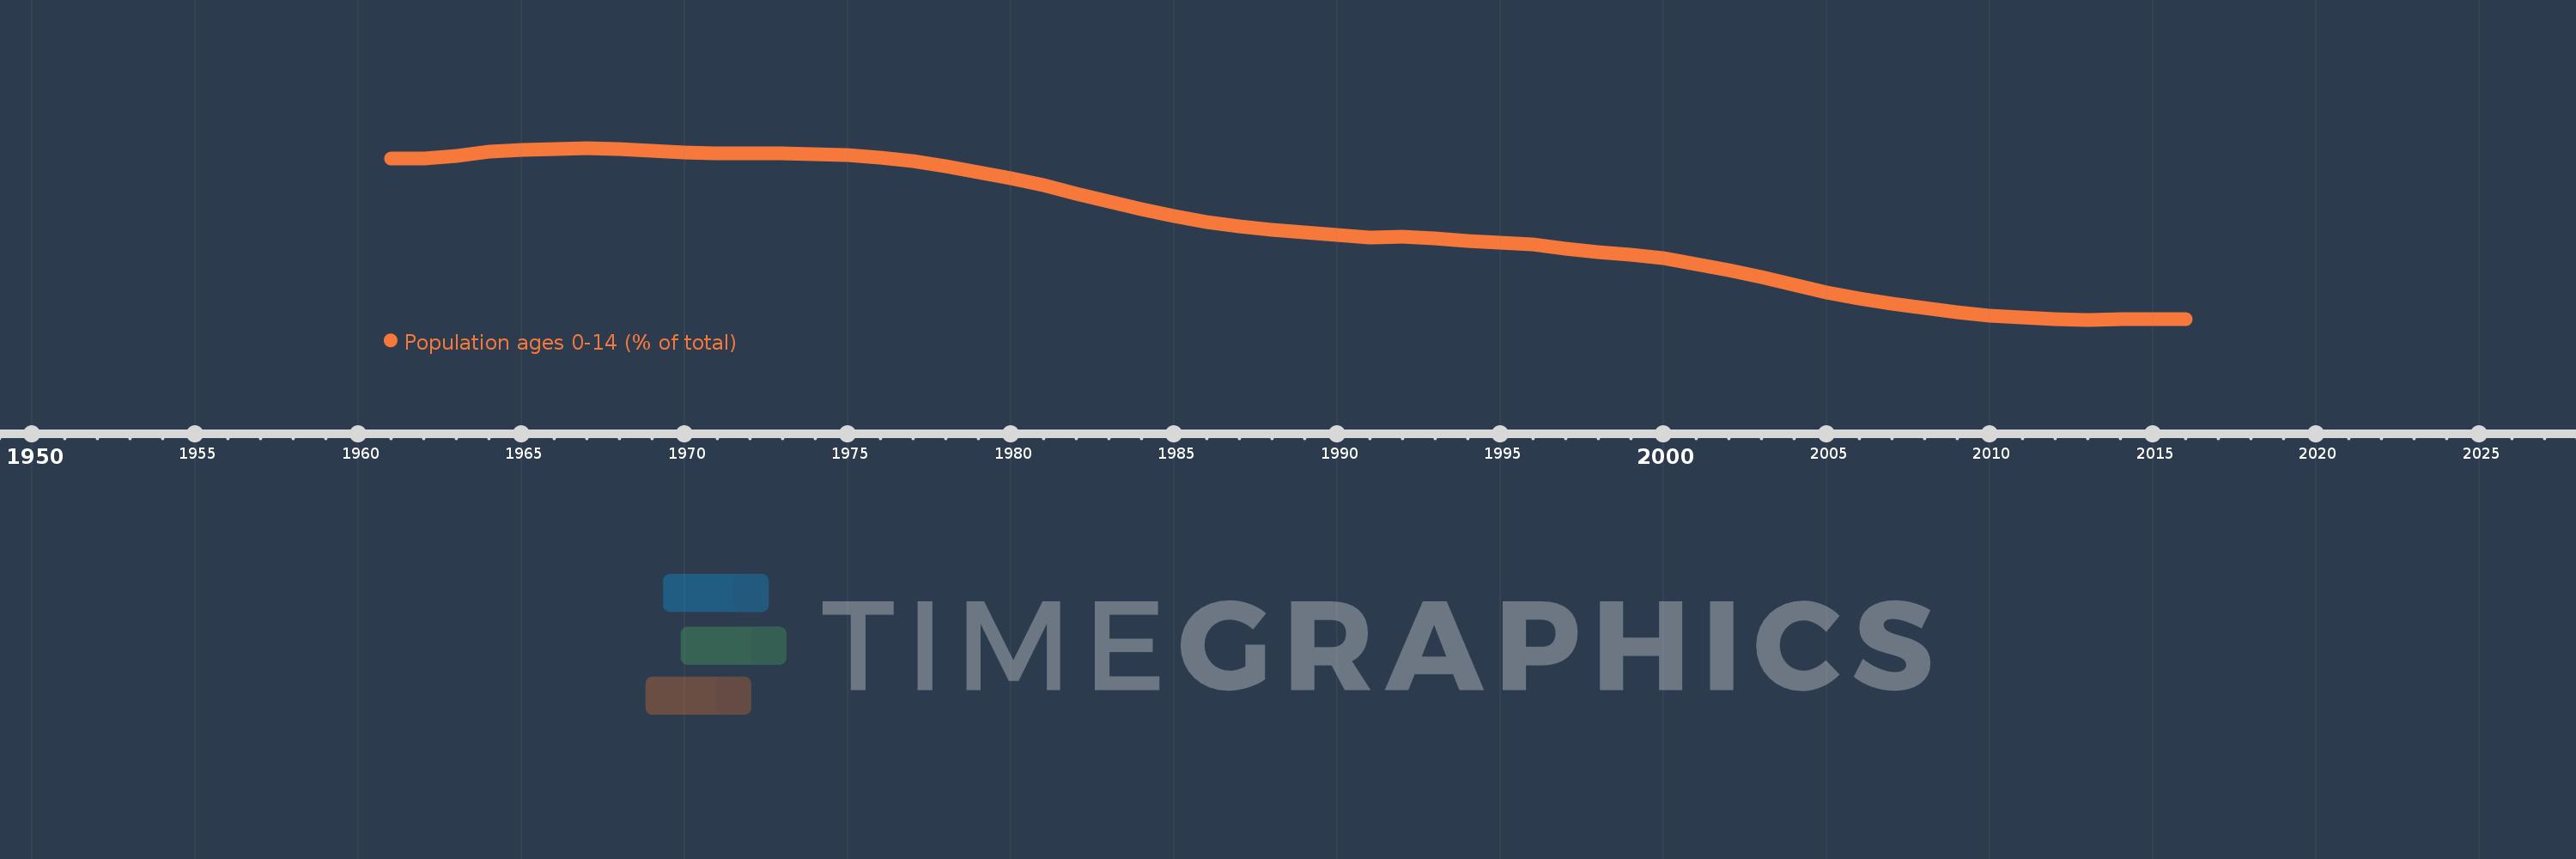
Population ages 0-14 (% of total)
2016,2015,2014,2013,2012,2011,2010,2009,2008,2007,2006,2005,2004,2003,2002,2001,2000,1999,1998,1997,1996,1995,1994,1993,1992,1991,1990,1989,1988,1987,1986,1985,1984,1983,1982,1981,1980,1979,1978,1977,1976,1975,1974,1973,1972,1971,1970,1969,1968,1967,1966,1965,1964,1963,1962,1961
This statistics in other country:
AfghanistanAlbaniaAlgeriaAngolaAntigua and BarbudaArab WorldArgentinaArmeniaArubaAustraliaAustriaAzerbaijanBahamas, TheBahrainBangladeshBarbadosBelarusBelgiumBelizeBeninBhutanBoliviaBosnia and HerzegovinaBotswanaBrazilBrunei DarussalamBulgariaBurkina FasoBurundiCabo VerdeCambodiaCameroonCanadaCaribbean small statesCentral African RepublicCentral Europe and the BalticsChadChannel IslandsChileChinaColombiaComorosCongo, Dem. Rep.Congo, Rep.Costa RicaCote d'IvoireCroatiaCubaCuracaoCyprusCzech RepublicDenmarkDjiboutiDominican RepublicEarly-demographic dividendEast Asia & PacificEast Asia & Pacific (excluding high income)East Asia & Pacific (IDA & IBRD countries)EcuadorEgypt, Arab Rep.El SalvadorEquatorial GuineaEritreaEstoniaEthiopiaEuro areaEurope & Central AsiaEurope & Central Asia (excluding high income)Europe & Central Asia (IDA & IBRD countries)European UnionFijiFinlandFragile and conflict affected situationsFranceFrench PolynesiaGabonGambia, TheGeorgiaGermanyGhanaGreeceGrenadaGuamGuatemalaGuineaGuinea-BissauGuyanaHaitiHeavily indebted poor countries (HIPC)High incomeHondurasHong Kong SAR, ChinaHungaryIBRD onlyIcelandIDA & IBRD totalIDA blendIDA onlyIDA totalIndiaIndonesiaIran, Islamic Rep.IraqIrelandIsraelItalyJamaicaJapanJordanKazakhstanKenyaKiribatiKorea, Dem. People’s Rep.Korea, Rep.KosovoKuwaitKyrgyz RepublicLao PDRLate-demographic dividendLatin America & Caribbean Latin America & Caribbean (excluding high income)Latin America & the Caribbean (IDA & IBRD countries)LatviaLeast developed countries: UN classificationLebanonLesothoLiberiaLibyaLithuaniaLow & middle incomeLow incomeLower middle incomeLuxembourgMacao SAR, ChinaMacedonia, FYRMadagascarMalawiMalaysiaMaldivesMaliMaltaMauritaniaMauritiusMexicoMicronesia, Fed. Sts.Middle East & North AfricaMiddle East & North Africa (excluding high income)Middle East & North Africa (IDA & IBRD countries)Middle incomeMoldovaMongoliaMontenegroMoroccoMozambiqueMyanmarNamibiaNepalNetherlandsNew CaledoniaNew ZealandNicaraguaNigerNigeriaNorth AmericaNorwayOECD membersOmanOther small statesPacific island small statesPakistanPanamaPapua New GuineaParaguayPeruPhilippinesPolandPortugalPost-demographic dividendPre-demographic dividendPuerto RicoQatarRomaniaRussian FederationRwandaSamoaSao Tome and PrincipeSaudi ArabiaSenegalSerbiaSeychellesSierra LeoneSingaporeSlovak RepublicSloveniaSmall statesSolomon IslandsSomaliaSouth AfricaSouth AsiaSouth Asia (IDA & IBRD)South SudanSpainSri LankaSt. LuciaSt. Vincent and the GrenadinesSub-Saharan Africa Sub-Saharan Africa (excluding high income)Sub-Saharan Africa (IDA & IBRD countries)SudanSurinameSwazilandSwedenSwitzerlandSyrian Arab RepublicTajikistanTanzaniaThailandTimor-LesteTogoTongaTrinidad and TobagoTunisiaTurkeyTurkmenistanUgandaUkraineUnited Arab EmiratesUnited KingdomUnited StatesUpper middle incomeUruguayUzbekistanVanuatuVenezuela, RBVietnamVirgin Islands (U.S.)West Bank and GazaWorldYemen, Rep.ZambiaZimbabwe Timeline:
This timeline shows a graph from 1961 to 2016 of China. No data until 1960. Number of actual observations by date: 56.
Source name:
World Development Indicators
Source organization:
World Bank staff estimates based on age distributions of United Nations Population Division's World Population Prospects.
Categories, topics:
Education, Health
Last updated:
apr 23, 2017
Indicators value changes by year
Minimum:
17.127
jan 1, 2013
At the date of observation
Value
Absolute change
Change from previous value
jan 1, 1961
39.955
+39.955
0.0%
jan 1, 1962
40.014
+0.059
0.15%
jan 1, 1963
40.41
+0.396
0.99%
jan 1, 1964
40.916
+0.506
1.25%
jan 1, 1965
41.242
+0.326
0.8%
jan 1, 1966
41.296
+0.054
0.13%
jan 1, 1967
41.5
+0.204
0.49%
jan 1, 1968
41.377
-0.123
-0.3%
jan 1, 1969
41.081
-0.296
-0.72%
jan 1, 1970
40.821
-0.26
-0.63%
jan 1, 1971
40.674
-0.147
-0.36%
jan 1, 1972
40.712
+0.038
0.09%
jan 1, 1973
40.704
-0.008
-0.02%
jan 1, 1974
40.647
-0.057
-0.14%
jan 1, 1975
40.479
-0.168
-0.41%
jan 1, 1976
40.148
-0.331
-0.82%
jan 1, 1977
39.585
-0.563
-1.4%
jan 1, 1978
38.907
-0.678
-1.71%
jan 1, 1979
38.103
-0.803
-2.06%
jan 1, 1980
37.189
-0.914
-2.4%
jan 1, 1981
36.196
-0.993
-2.67%
jan 1, 1982
35.033
-1.163
-3.21%
jan 1, 1983
33.918
-1.114
-3.18%
jan 1, 1984
32.845
-1.073
-3.16%
jan 1, 1985
31.834
-1.011
-3.08%
jan 1, 1986
30.932
-0.903
-2.84%
jan 1, 1987
30.327
-0.604
-1.95%
jan 1, 1988
29.84
-0.487
-1.6%
jan 1, 1989
29.465
-0.376
-1.26%
jan 1, 1990
29.15
-0.315
-1.07%
jan 1, 1991
28.842
-0.308
-1.06%
jan 1, 1992
28.868
+0.026
0.09%
jan 1, 1993
28.66
-0.208
-0.72%
jan 1, 1994
28.338
-0.322
-1.12%
jan 1, 1995
28.042
-0.297
-1.05%
jan 1, 1996
27.806
-0.235
-0.84%
jan 1, 1997
27.188
-0.618
-2.22%
jan 1, 1998
26.767
-0.421
-1.55%
jan 1, 1999
26.388
-0.379
-1.42%
jan 1, 2000
25.844
-0.544
-2.06%
jan 1, 2001
25.065
-0.779
-3.01%
jan 1, 2002
24.204
-0.861
-3.44%
jan 1, 2003
23.197
-1.007
-4.16%
jan 1, 2004
22.1
-1.097
-4.73%
jan 1, 2005
21.037
-1.062
-4.81%
jan 1, 2006
20.089
-0.948
-4.51%
jan 1, 2007
19.401
-0.688
-3.42%
jan 1, 2008
18.743
-0.658
-3.39%
jan 1, 2009
18.169
-0.574
-3.06%
jan 1, 2010
17.723
-0.446
-2.46%
jan 1, 2011
17.415
-0.308
-1.74%
jan 1, 2012
17.2
-0.214
-1.23%
jan 1, 2013
17.127
-0.073
-0.43%
jan 1, 2014
17.154
+0.027
0.16%
jan 1, 2015
17.205
+0.051
0.29%
jan 1, 2016
17.232
+0.027
0.16%
Ranking of countries by current statistics by years


Comments: