29
/
en
AIzaSyAYiBZKx7MnpbEhh9jyipgxe19OcubqV5w
April 1, 2024
84564
Benin
BEN
true
2
1
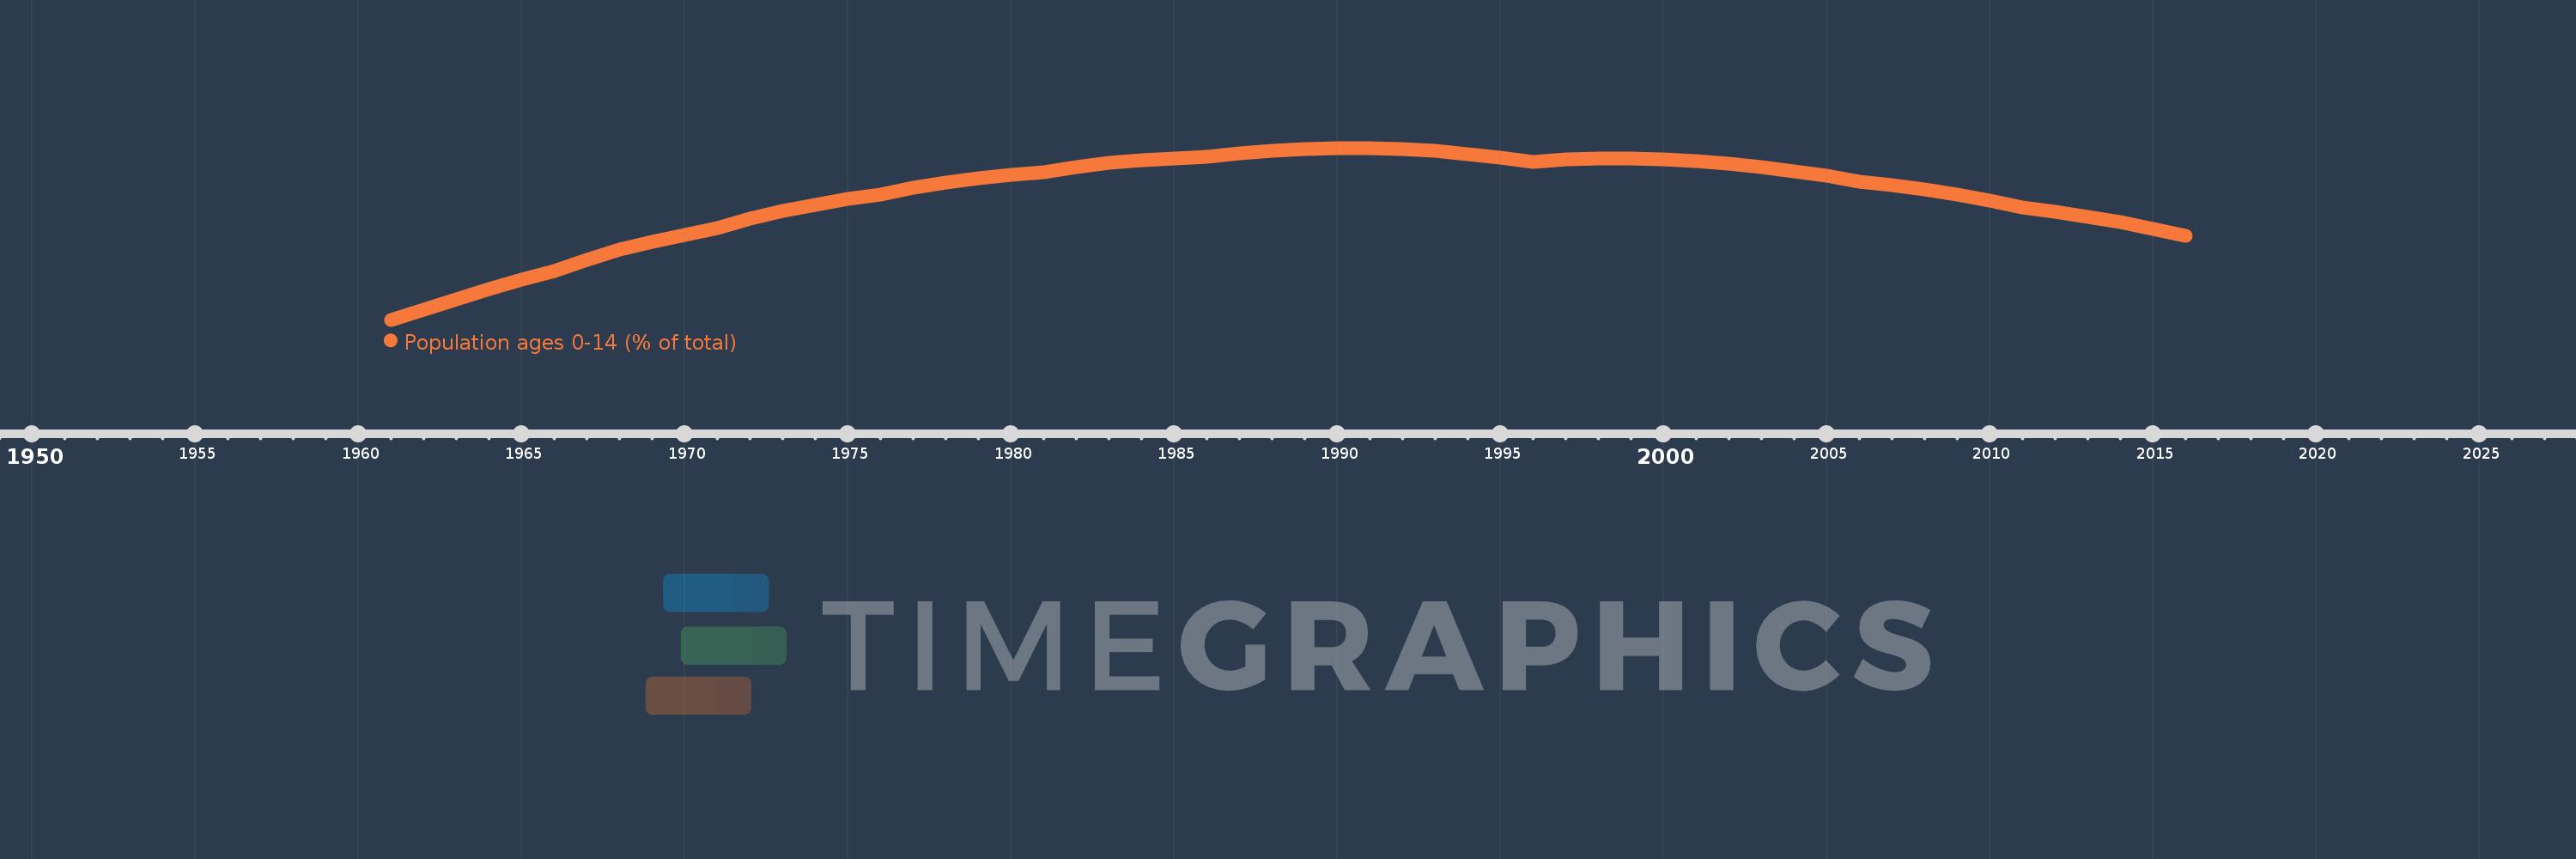
Population ages 0-14 (% of total)
2016,2015,2014,2013,2012,2011,2010,2009,2008,2007,2006,2005,2004,2003,2002,2001,2000,1999,1998,1997,1996,1995,1994,1993,1992,1991,1990,1989,1988,1987,1986,1985,1984,1983,1982,1981,1980,1979,1978,1977,1976,1975,1974,1973,1972,1971,1970,1969,1968,1967,1966,1965,1964,1963,1962,1961
This statistics in other country:
AfghanistanAlbaniaAlgeriaAngolaAntigua and BarbudaArab WorldArgentinaArmeniaArubaAustraliaAustriaAzerbaijanBahamas, TheBahrainBangladeshBarbadosBelarusBelgiumBelizeBeninBhutanBoliviaBosnia and HerzegovinaBotswanaBrazilBrunei DarussalamBulgariaBurkina FasoBurundiCabo VerdeCambodiaCameroonCanadaCaribbean small statesCentral African RepublicCentral Europe and the BalticsChadChannel IslandsChileChinaColombiaComorosCongo, Dem. Rep.Congo, Rep.Costa RicaCote d'IvoireCroatiaCubaCuracaoCyprusCzech RepublicDenmarkDjiboutiDominican RepublicEarly-demographic dividendEast Asia & PacificEast Asia & Pacific (excluding high income)East Asia & Pacific (IDA & IBRD countries)EcuadorEgypt, Arab Rep.El SalvadorEquatorial GuineaEritreaEstoniaEthiopiaEuro areaEurope & Central AsiaEurope & Central Asia (excluding high income)Europe & Central Asia (IDA & IBRD countries)European UnionFijiFinlandFragile and conflict affected situationsFranceFrench PolynesiaGabonGambia, TheGeorgiaGermanyGhanaGreeceGrenadaGuamGuatemalaGuineaGuinea-BissauGuyanaHaitiHeavily indebted poor countries (HIPC)High incomeHondurasHong Kong SAR, ChinaHungaryIBRD onlyIcelandIDA & IBRD totalIDA blendIDA onlyIDA totalIndiaIndonesiaIran, Islamic Rep.IraqIrelandIsraelItalyJamaicaJapanJordanKazakhstanKenyaKiribatiKorea, Dem. People’s Rep.Korea, Rep.KosovoKuwaitKyrgyz RepublicLao PDRLate-demographic dividendLatin America & Caribbean Latin America & Caribbean (excluding high income)Latin America & the Caribbean (IDA & IBRD countries)LatviaLeast developed countries: UN classificationLebanonLesothoLiberiaLibyaLithuaniaLow & middle incomeLow incomeLower middle incomeLuxembourgMacao SAR, ChinaMacedonia, FYRMadagascarMalawiMalaysiaMaldivesMaliMaltaMauritaniaMauritiusMexicoMicronesia, Fed. Sts.Middle East & North AfricaMiddle East & North Africa (excluding high income)Middle East & North Africa (IDA & IBRD countries)Middle incomeMoldovaMongoliaMontenegroMoroccoMozambiqueMyanmarNamibiaNepalNetherlandsNew CaledoniaNew ZealandNicaraguaNigerNigeriaNorth AmericaNorwayOECD membersOmanOther small statesPacific island small statesPakistanPanamaPapua New GuineaParaguayPeruPhilippinesPolandPortugalPost-demographic dividendPre-demographic dividendPuerto RicoQatarRomaniaRussian FederationRwandaSamoaSao Tome and PrincipeSaudi ArabiaSenegalSerbiaSeychellesSierra LeoneSingaporeSlovak RepublicSloveniaSmall statesSolomon IslandsSomaliaSouth AfricaSouth AsiaSouth Asia (IDA & IBRD)South SudanSpainSri LankaSt. LuciaSt. Vincent and the GrenadinesSub-Saharan Africa Sub-Saharan Africa (excluding high income)Sub-Saharan Africa (IDA & IBRD countries)SudanSurinameSwazilandSwedenSwitzerlandSyrian Arab RepublicTajikistanTanzaniaThailandTimor-LesteTogoTongaTrinidad and TobagoTunisiaTurkeyTurkmenistanUgandaUkraineUnited Arab EmiratesUnited KingdomUnited StatesUpper middle incomeUruguayUzbekistanVanuatuVenezuela, RBVietnamVirgin Islands (U.S.)West Bank and GazaWorldYemen, Rep.ZambiaZimbabwe Timeline:
This timeline shows a graph from 1961 to 2016 of Benin. No data until 1960. Number of actual observations by date: 56.
Source name:
World Development Indicators
Source organization:
World Bank staff estimates based on age distributions of United Nations Population Division's World Population Prospects.
Categories, topics:
Education, Health
Last updated:
apr 23, 2017
Indicators value changes by year
Minimum:
38.532
jan 1, 1961
At the date of observation
Value
Absolute change
Change from previous value
jan 1, 1961
38.532
+38.532
0.0%
jan 1, 1962
38.974
+0.442
1.15%
jan 1, 1963
39.423
+0.449
1.15%
jan 1, 1964
39.869
+0.446
1.13%
jan 1, 1965
40.279
+0.41
1.03%
jan 1, 1966
40.635
+0.356
0.88%
jan 1, 1967
41.149
+0.514
1.26%
jan 1, 1968
41.57
+0.422
1.02%
jan 1, 1969
41.921
+0.351
0.84%
jan 1, 1970
42.226
+0.305
0.73%
jan 1, 1971
42.498
+0.272
0.64%
jan 1, 1972
42.913
+0.414
0.97%
jan 1, 1973
43.254
+0.341
0.79%
jan 1, 1974
43.535
+0.281
0.65%
jan 1, 1975
43.767
+0.232
0.53%
jan 1, 1976
43.957
+0.19
0.43%
jan 1, 1977
44.263
+0.306
0.7%
jan 1, 1978
44.503
+0.24
0.54%
jan 1, 1979
44.69
+0.187
0.42%
jan 1, 1980
44.835
+0.144
0.32%
jan 1, 1981
44.944
+0.11
0.24%
jan 1, 1982
45.176
+0.232
0.52%
jan 1, 1983
45.342
+0.166
0.37%
jan 1, 1984
45.46
+0.118
0.26%
jan 1, 1985
45.546
+0.086
0.19%
jan 1, 1986
45.608
+0.062
0.14%
jan 1, 1987
45.769
+0.161
0.35%
jan 1, 1988
45.876
+0.108
0.24%
jan 1, 1989
45.943
+0.066
0.14%
jan 1, 1990
45.978
+0.035
0.08%
jan 1, 1991
45.99
+0.012
0.03%
jan 1, 1992
45.943
-0.047
-0.1%
jan 1, 1993
45.849
-0.094
-0.2%
jan 1, 1994
45.722
-0.127
-0.28%
jan 1, 1995
45.564
-0.158
-0.35%
jan 1, 1996
45.375
-0.189
-0.42%
jan 1, 1997
45.482
+0.108
0.24%
jan 1, 1998
45.528
+0.046
0.1%
jan 1, 1999
45.525
-0.003
-0.01%
jan 1, 2000
45.489
-0.036
-0.08%
jan 1, 2001
45.43
-0.058
-0.13%
jan 1, 2002
45.314
-0.116
-0.26%
jan 1, 2003
45.165
-0.15
-0.33%
jan 1, 2004
44.984
-0.181
-0.4%
jan 1, 2005
44.769
-0.215
-0.48%
jan 1, 2006
44.518
-0.251
-0.56%
jan 1, 2007
44.385
-0.132
-0.3%
jan 1, 2008
44.197
-0.189
-0.42%
jan 1, 2009
43.965
-0.231
-0.52%
jan 1, 2010
43.705
-0.26
-0.59%
jan 1, 2011
43.421
-0.284
-0.65%
jan 1, 2012
43.233
-0.188
-0.43%
jan 1, 2013
43.01
-0.223
-0.52%
jan 1, 2014
42.755
-0.255
-0.59%
jan 1, 2015
42.47
-0.285
-0.67%
jan 1, 2016
42.158
-0.311
-0.73%
Ranking of countries by current statistics by years


Comments: