29
/
en
AIzaSyAYiBZKx7MnpbEhh9jyipgxe19OcubqV5w
April 1, 2024
81034
Belarus
BLR
true
2
1
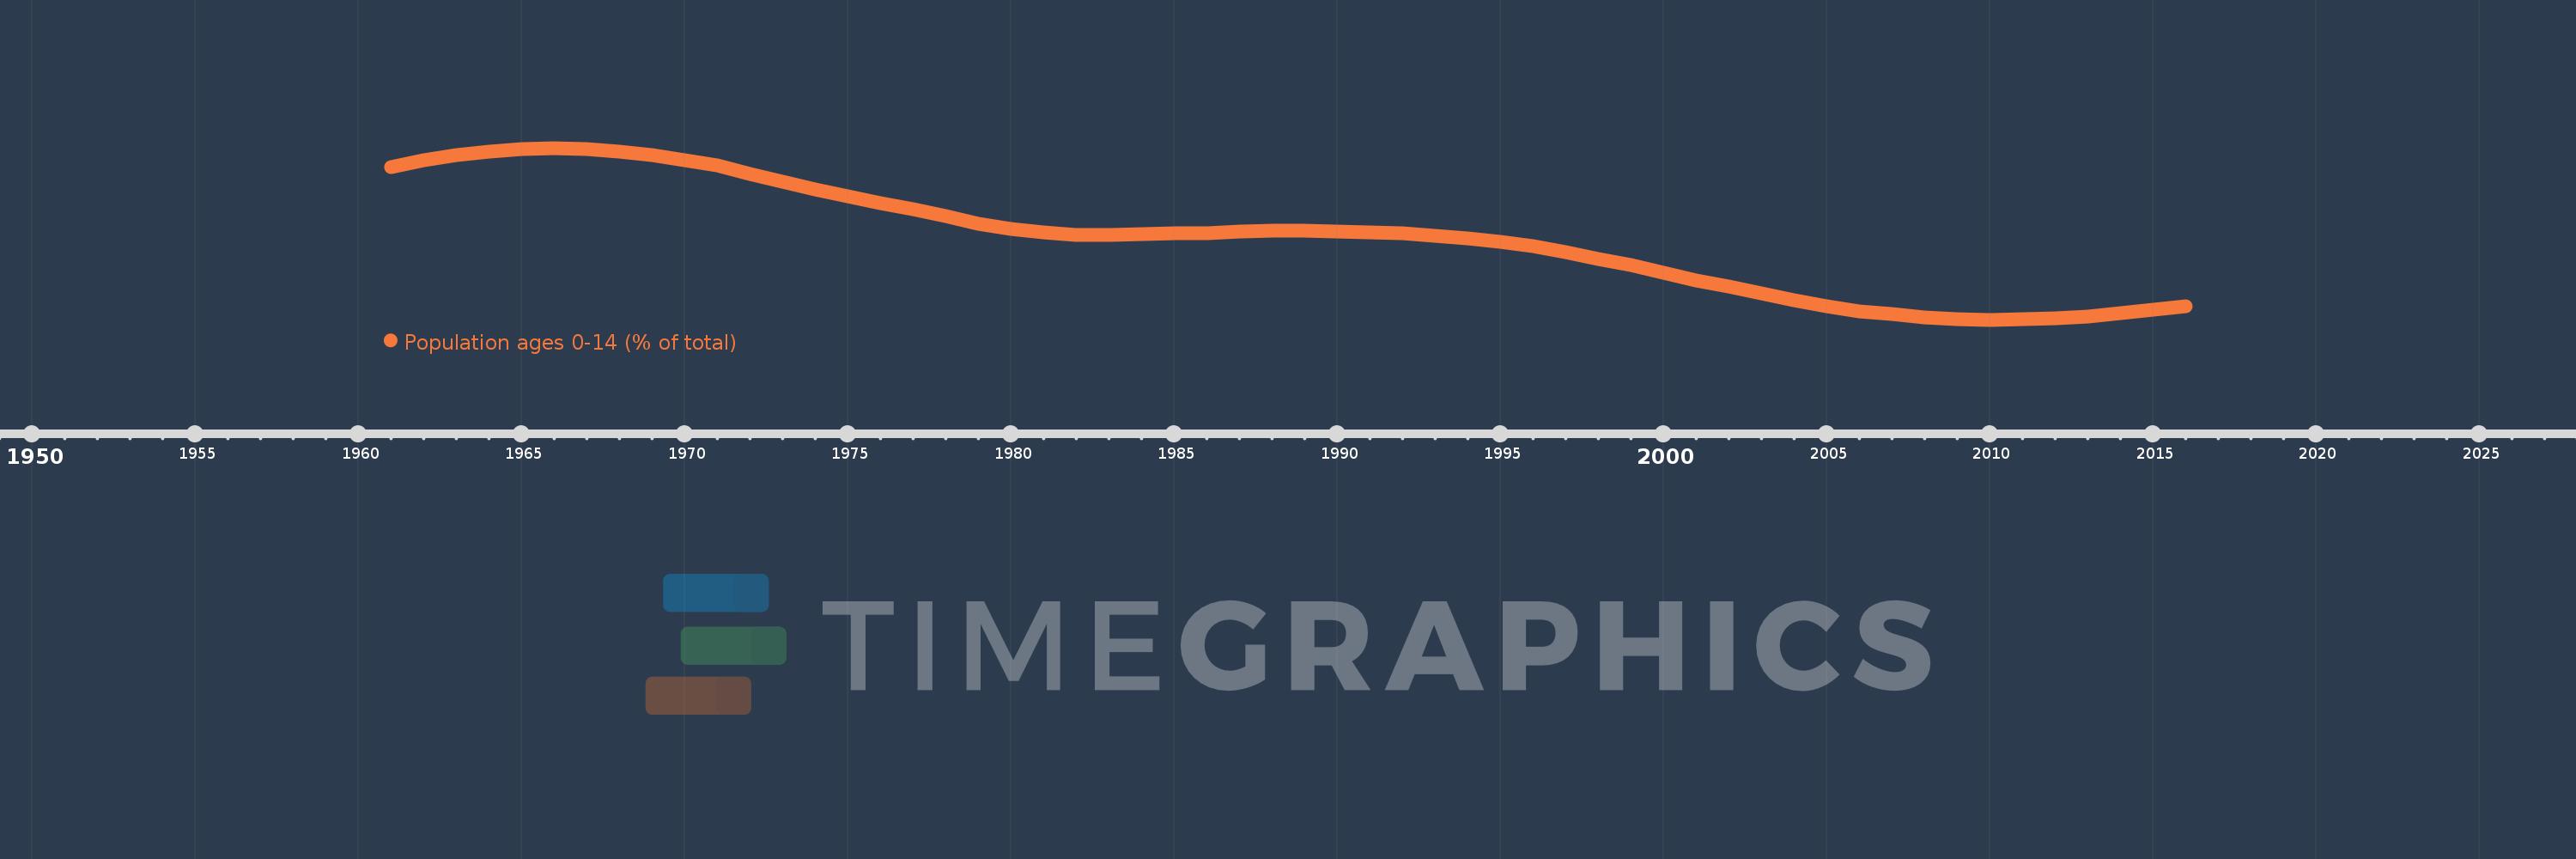
Population ages 0-14 (% of total)
2016,2015,2014,2013,2012,2011,2010,2009,2008,2007,2006,2005,2004,2003,2002,2001,2000,1999,1998,1997,1996,1995,1994,1993,1992,1991,1990,1989,1988,1987,1986,1985,1984,1983,1982,1981,1980,1979,1978,1977,1976,1975,1974,1973,1972,1971,1970,1969,1968,1967,1966,1965,1964,1963,1962,1961
This statistics in other country:
AfghanistanAlbaniaAlgeriaAngolaAntigua and BarbudaArab WorldArgentinaArmeniaArubaAustraliaAustriaAzerbaijanBahamas, TheBahrainBangladeshBarbadosBelarusBelgiumBelizeBeninBhutanBoliviaBosnia and HerzegovinaBotswanaBrazilBrunei DarussalamBulgariaBurkina FasoBurundiCabo VerdeCambodiaCameroonCanadaCaribbean small statesCentral African RepublicCentral Europe and the BalticsChadChannel IslandsChileChinaColombiaComorosCongo, Dem. Rep.Congo, Rep.Costa RicaCote d'IvoireCroatiaCubaCuracaoCyprusCzech RepublicDenmarkDjiboutiDominican RepublicEarly-demographic dividendEast Asia & PacificEast Asia & Pacific (excluding high income)East Asia & Pacific (IDA & IBRD countries)EcuadorEgypt, Arab Rep.El SalvadorEquatorial GuineaEritreaEstoniaEthiopiaEuro areaEurope & Central AsiaEurope & Central Asia (excluding high income)Europe & Central Asia (IDA & IBRD countries)European UnionFijiFinlandFragile and conflict affected situationsFranceFrench PolynesiaGabonGambia, TheGeorgiaGermanyGhanaGreeceGrenadaGuamGuatemalaGuineaGuinea-BissauGuyanaHaitiHeavily indebted poor countries (HIPC)High incomeHondurasHong Kong SAR, ChinaHungaryIBRD onlyIcelandIDA & IBRD totalIDA blendIDA onlyIDA totalIndiaIndonesiaIran, Islamic Rep.IraqIrelandIsraelItalyJamaicaJapanJordanKazakhstanKenyaKiribatiKorea, Dem. People’s Rep.Korea, Rep.KosovoKuwaitKyrgyz RepublicLao PDRLate-demographic dividendLatin America & Caribbean Latin America & Caribbean (excluding high income)Latin America & the Caribbean (IDA & IBRD countries)LatviaLeast developed countries: UN classificationLebanonLesothoLiberiaLibyaLithuaniaLow & middle incomeLow incomeLower middle incomeLuxembourgMacao SAR, ChinaMacedonia, FYRMadagascarMalawiMalaysiaMaldivesMaliMaltaMauritaniaMauritiusMexicoMicronesia, Fed. Sts.Middle East & North AfricaMiddle East & North Africa (excluding high income)Middle East & North Africa (IDA & IBRD countries)Middle incomeMoldovaMongoliaMontenegroMoroccoMozambiqueMyanmarNamibiaNepalNetherlandsNew CaledoniaNew ZealandNicaraguaNigerNigeriaNorth AmericaNorwayOECD membersOmanOther small statesPacific island small statesPakistanPanamaPapua New GuineaParaguayPeruPhilippinesPolandPortugalPost-demographic dividendPre-demographic dividendPuerto RicoQatarRomaniaRussian FederationRwandaSamoaSao Tome and PrincipeSaudi ArabiaSenegalSerbiaSeychellesSierra LeoneSingaporeSlovak RepublicSloveniaSmall statesSolomon IslandsSomaliaSouth AfricaSouth AsiaSouth Asia (IDA & IBRD)South SudanSpainSri LankaSt. LuciaSt. Vincent and the GrenadinesSub-Saharan Africa Sub-Saharan Africa (excluding high income)Sub-Saharan Africa (IDA & IBRD countries)SudanSurinameSwazilandSwedenSwitzerlandSyrian Arab RepublicTajikistanTanzaniaThailandTimor-LesteTogoTongaTrinidad and TobagoTunisiaTurkeyTurkmenistanUgandaUkraineUnited Arab EmiratesUnited KingdomUnited StatesUpper middle incomeUruguayUzbekistanVanuatuVenezuela, RBVietnamVirgin Islands (U.S.)West Bank and GazaWorldYemen, Rep.ZambiaZimbabwe Timeline:
This timeline shows a graph from 1961 to 2016 of Belarus. No data until 1960. Number of actual observations by date: 56.
Source name:
World Development Indicators
Source organization:
World Bank staff estimates based on age distributions of United Nations Population Division's World Population Prospects.
Categories, topics:
Education, Health
Last updated:
apr 23, 2017
Indicators value changes by year
Maximum:
30.666
jan 1, 1966
At the date of observation
Value
Absolute change
Change from previous value
jan 1, 1961
28.861
+28.861
0.0%
jan 1, 1962
29.537
+0.676
2.34%
jan 1, 1963
30.019
+0.482
1.63%
jan 1, 1964
30.336
+0.317
1.06%
jan 1, 1965
30.545
+0.209
0.69%
jan 1, 1966
30.666
+0.121
0.4%
jan 1, 1967
30.535
-0.131
-0.43%
jan 1, 1968
30.309
-0.226
-0.74%
jan 1, 1969
29.978
-0.331
-1.09%
jan 1, 1970
29.542
-0.436
-1.45%
jan 1, 1971
29.02
-0.522
-1.77%
jan 1, 1972
28.233
-0.787
-2.71%
jan 1, 1973
27.529
-0.704
-2.49%
jan 1, 1974
26.876
-0.654
-2.37%
jan 1, 1975
26.223
-0.653
-2.43%
jan 1, 1976
25.547
-0.675
-2.58%
jan 1, 1977
24.993
-0.554
-2.17%
jan 1, 1978
24.347
-0.646
-2.59%
jan 1, 1979
23.697
-0.65
-2.67%
jan 1, 1980
23.177
-0.52
-2.2%
jan 1, 1981
22.848
-0.329
-1.42%
jan 1, 1982
22.651
-0.197
-0.86%
jan 1, 1983
22.621
-0.03
-0.13%
jan 1, 1984
22.701
+0.08
0.35%
jan 1, 1985
22.786
+0.085
0.37%
jan 1, 1986
22.821
+0.035
0.15%
jan 1, 1987
22.958
+0.136
0.6%
jan 1, 1988
23.02
+0.062
0.27%
jan 1, 1989
23.012
-0.008
-0.03%
jan 1, 1990
22.962
-0.05
-0.22%
jan 1, 1991
22.877
-0.085
-0.37%
jan 1, 1992
22.765
-0.112
-0.49%
jan 1, 1993
22.587
-0.178
-0.78%
jan 1, 1994
22.34
-0.247
-1.09%
jan 1, 1995
22.025
-0.316
-1.41%
jan 1, 1996
21.642
-0.382
-1.73%
jan 1, 1997
21.038
-0.605
-2.79%
jan 1, 1998
20.448
-0.59
-2.8%
jan 1, 1999
19.839
-0.609
-2.98%
jan 1, 2000
19.181
-0.658
-3.32%
jan 1, 2001
18.479
-0.702
-3.66%
jan 1, 2002
17.853
-0.626
-3.39%
jan 1, 2003
17.217
-0.636
-3.56%
jan 1, 2004
16.601
-0.616
-3.58%
jan 1, 2005
16.057
-0.544
-3.28%
jan 1, 2006
15.617
-0.44
-2.74%
jan 1, 2007
15.313
-0.304
-1.95%
jan 1, 2008
15.064
-0.25
-1.63%
jan 1, 2009
14.894
-0.17
-1.13%
jan 1, 2010
14.82
-0.074
-0.5%
jan 1, 2011
14.846
+0.026
0.18%
jan 1, 2012
14.924
+0.078
0.52%
jan 1, 2013
15.13
+0.206
1.38%
jan 1, 2014
15.437
+0.307
2.03%
jan 1, 2015
15.769
+0.332
2.15%
jan 1, 2016
16.068
+0.299
1.9%
Ranking of countries by current statistics by years


Comments: