29
/
en
AIzaSyAYiBZKx7MnpbEhh9jyipgxe19OcubqV5w
April 1, 2024
270863
Turkmenistan
TKM
true
2
1
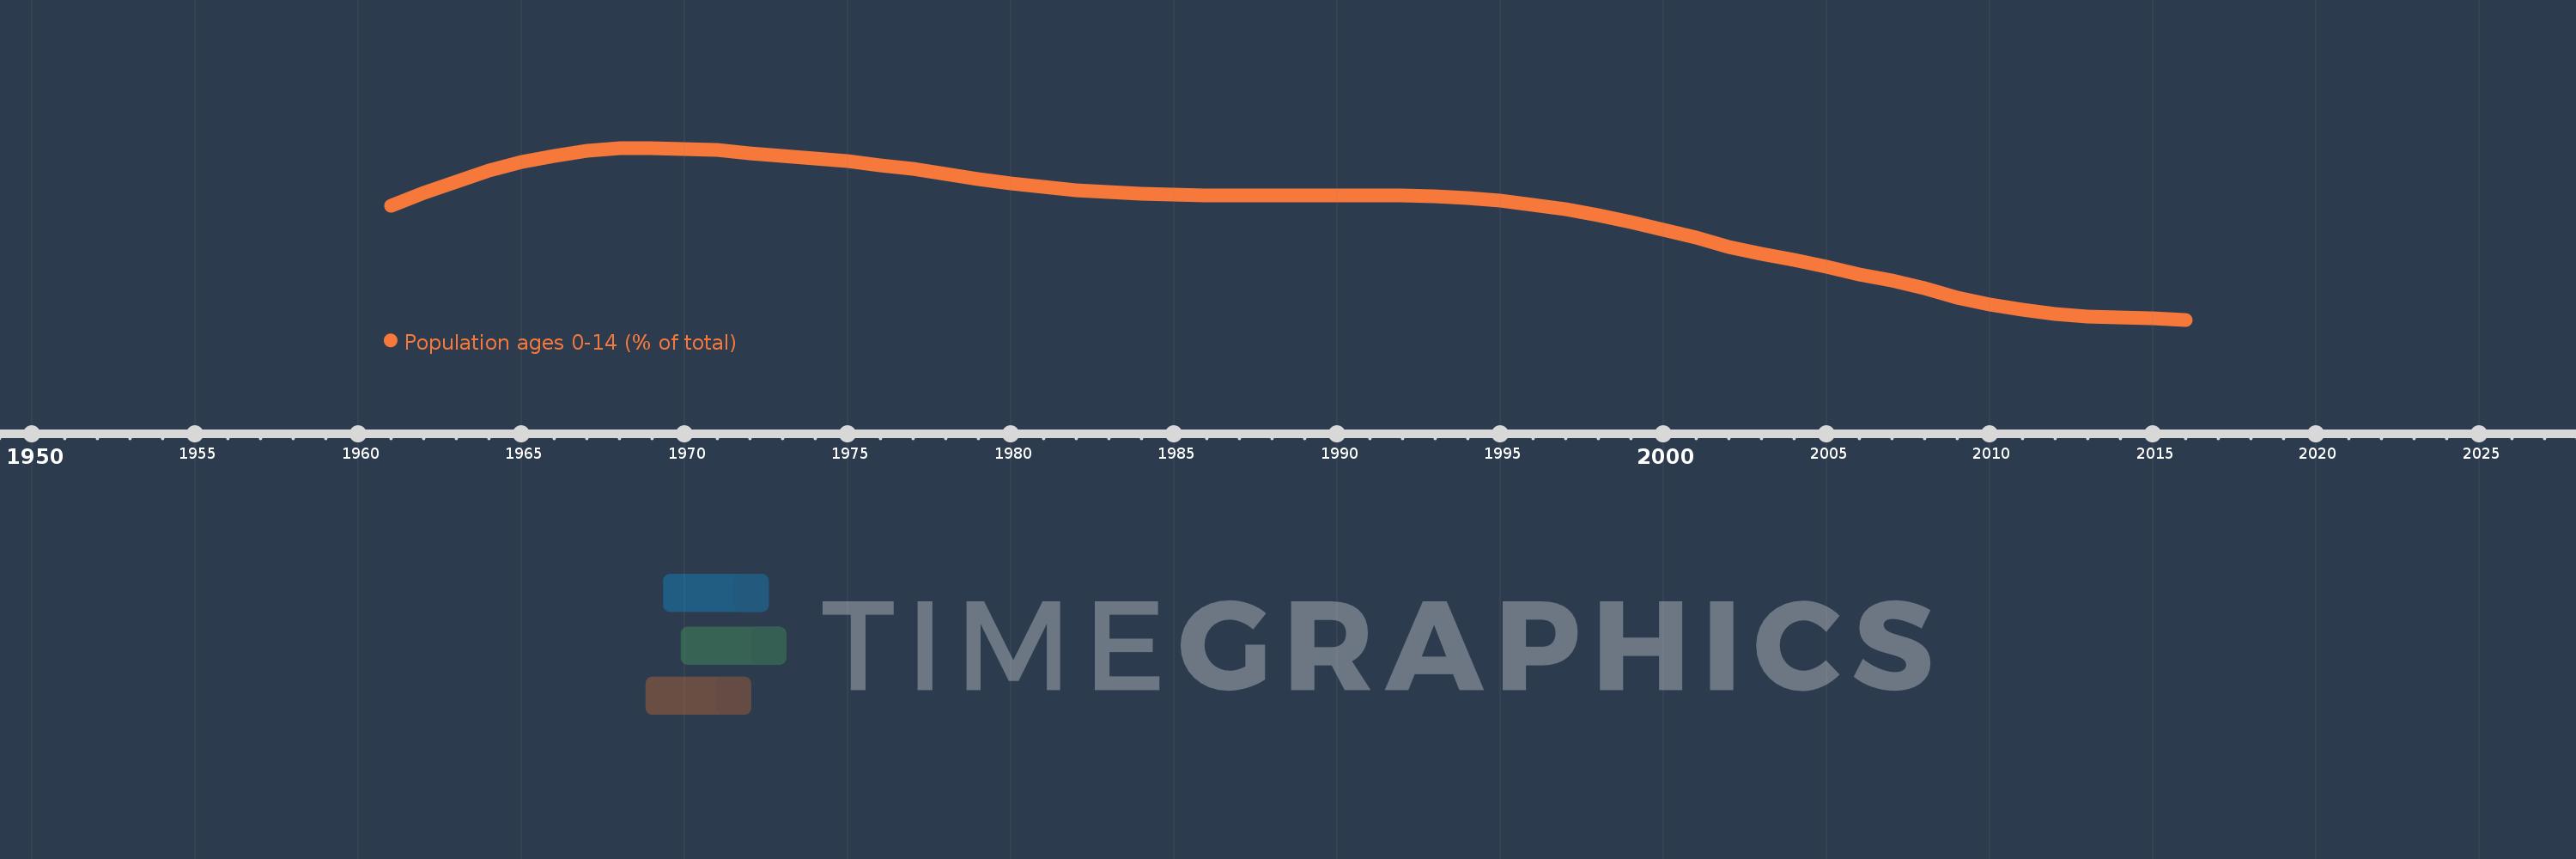
Population ages 0-14 (% of total)
2016,2015,2014,2013,2012,2011,2010,2009,2008,2007,2006,2005,2004,2003,2002,2001,2000,1999,1998,1997,1996,1995,1994,1993,1992,1991,1990,1989,1988,1987,1986,1985,1984,1983,1982,1981,1980,1979,1978,1977,1976,1975,1974,1973,1972,1971,1970,1969,1968,1967,1966,1965,1964,1963,1962,1961
This statistics in other country:
AfghanistanAlbaniaAlgeriaAngolaAntigua and BarbudaArab WorldArgentinaArmeniaArubaAustraliaAustriaAzerbaijanBahamas, TheBahrainBangladeshBarbadosBelarusBelgiumBelizeBeninBhutanBoliviaBosnia and HerzegovinaBotswanaBrazilBrunei DarussalamBulgariaBurkina FasoBurundiCabo VerdeCambodiaCameroonCanadaCaribbean small statesCentral African RepublicCentral Europe and the BalticsChadChannel IslandsChileChinaColombiaComorosCongo, Dem. Rep.Congo, Rep.Costa RicaCote d'IvoireCroatiaCubaCuracaoCyprusCzech RepublicDenmarkDjiboutiDominican RepublicEarly-demographic dividendEast Asia & PacificEast Asia & Pacific (excluding high income)East Asia & Pacific (IDA & IBRD countries)EcuadorEgypt, Arab Rep.El SalvadorEquatorial GuineaEritreaEstoniaEthiopiaEuro areaEurope & Central AsiaEurope & Central Asia (excluding high income)Europe & Central Asia (IDA & IBRD countries)European UnionFijiFinlandFragile and conflict affected situationsFranceFrench PolynesiaGabonGambia, TheGeorgiaGermanyGhanaGreeceGrenadaGuamGuatemalaGuineaGuinea-BissauGuyanaHaitiHeavily indebted poor countries (HIPC)High incomeHondurasHong Kong SAR, ChinaHungaryIBRD onlyIcelandIDA & IBRD totalIDA blendIDA onlyIDA totalIndiaIndonesiaIran, Islamic Rep.IraqIrelandIsraelItalyJamaicaJapanJordanKazakhstanKenyaKiribatiKorea, Dem. People’s Rep.Korea, Rep.KosovoKuwaitKyrgyz RepublicLao PDRLate-demographic dividendLatin America & Caribbean Latin America & Caribbean (excluding high income)Latin America & the Caribbean (IDA & IBRD countries)LatviaLeast developed countries: UN classificationLebanonLesothoLiberiaLibyaLithuaniaLow & middle incomeLow incomeLower middle incomeLuxembourgMacao SAR, ChinaMacedonia, FYRMadagascarMalawiMalaysiaMaldivesMaliMaltaMauritaniaMauritiusMexicoMicronesia, Fed. Sts.Middle East & North AfricaMiddle East & North Africa (excluding high income)Middle East & North Africa (IDA & IBRD countries)Middle incomeMoldovaMongoliaMontenegroMoroccoMozambiqueMyanmarNamibiaNepalNetherlandsNew CaledoniaNew ZealandNicaraguaNigerNigeriaNorth AmericaNorwayOECD membersOmanOther small statesPacific island small statesPakistanPanamaPapua New GuineaParaguayPeruPhilippinesPolandPortugalPost-demographic dividendPre-demographic dividendPuerto RicoQatarRomaniaRussian FederationRwandaSamoaSao Tome and PrincipeSaudi ArabiaSenegalSerbiaSeychellesSierra LeoneSingaporeSlovak RepublicSloveniaSmall statesSolomon IslandsSomaliaSouth AfricaSouth AsiaSouth Asia (IDA & IBRD)South SudanSpainSri LankaSt. LuciaSt. Vincent and the GrenadinesSub-Saharan Africa Sub-Saharan Africa (excluding high income)Sub-Saharan Africa (IDA & IBRD countries)SudanSurinameSwazilandSwedenSwitzerlandSyrian Arab RepublicTajikistanTanzaniaThailandTimor-LesteTogoTongaTrinidad and TobagoTunisiaTurkeyTurkmenistanUgandaUkraineUnited Arab EmiratesUnited KingdomUnited StatesUpper middle incomeUruguayUzbekistanVanuatuVenezuela, RBVietnamVirgin Islands (U.S.)West Bank and GazaWorldYemen, Rep.ZambiaZimbabwe Timeline:
This timeline shows a graph from 1961 to 2016 of Turkmenistan. No data until 1960. Number of actual observations by date: 56.
Source name:
World Development Indicators
Source organization:
World Bank staff estimates based on age distributions of United Nations Population Division's World Population Prospects.
Categories, topics:
Education, Health
Last updated:
apr 23, 2017
Indicators value changes by year
Minimum:
28.224
jan 1, 2016
Maximum:
45.182
jan 1, 1969
At the date of observation
Value
Absolute change
Change from previous value
jan 1, 1961
39.484
+39.484
0.0%
jan 1, 1962
40.728
+1.244
3.15%
jan 1, 1963
41.891
+1.163
2.85%
jan 1, 1964
42.924
+1.033
2.47%
jan 1, 1965
43.763
+0.839
1.95%
jan 1, 1966
44.37
+0.607
1.39%
jan 1, 1967
44.916
+0.546
1.23%
jan 1, 1968
45.16
+0.244
0.54%
jan 1, 1969
45.182
+0.022
0.05%
jan 1, 1970
45.101
-0.081
-0.18%
jan 1, 1971
44.987
-0.113
-0.25%
jan 1, 1972
44.644
-0.344
-0.76%
jan 1, 1973
44.386
-0.258
-0.58%
jan 1, 1974
44.162
-0.224
-0.5%
jan 1, 1975
43.869
-0.294
-0.67%
jan 1, 1976
43.457
-0.412
-0.94%
jan 1, 1977
43.103
-0.354
-0.81%
jan 1, 1978
42.632
-0.471
-1.09%
jan 1, 1979
42.122
-0.51
-1.2%
jan 1, 1980
41.674
-0.447
-1.06%
jan 1, 1981
41.326
-0.348
-0.83%
jan 1, 1982
41.024
-0.303
-0.73%
jan 1, 1983
40.815
-0.209
-0.51%
jan 1, 1984
40.688
-0.127
-0.31%
jan 1, 1985
40.599
-0.089
-0.22%
jan 1, 1986
40.521
-0.079
-0.19%
jan 1, 1987
40.505
-0.016
-0.04%
jan 1, 1988
40.5
-0.005
-0.01%
jan 1, 1989
40.502
+0.002
0.0%
jan 1, 1990
40.497
-0.004
-0.01%
jan 1, 1991
40.471
-0.027
-0.07%
jan 1, 1992
40.502
+0.031
0.08%
jan 1, 1993
40.411
-0.092
-0.23%
jan 1, 1994
40.223
-0.188
-0.46%
jan 1, 1995
39.944
-0.279
-0.69%
jan 1, 1996
39.553
-0.391
-0.98%
jan 1, 1997
39.111
-0.443
-1.12%
jan 1, 1998
38.526
-0.585
-1.49%
jan 1, 1999
37.825
-0.701
-1.82%
jan 1, 2000
37.067
-0.758
-2.0%
jan 1, 2001
36.304
-0.764
-2.06%
jan 1, 2002
35.447
-0.857
-2.36%
jan 1, 2003
34.752
-0.694
-1.96%
jan 1, 2004
34.132
-0.621
-1.79%
jan 1, 2005
33.456
-0.676
-1.98%
jan 1, 2006
32.678
-0.778
-2.33%
jan 1, 2007
32.09
-0.588
-1.8%
jan 1, 2008
31.299
-0.791
-2.46%
jan 1, 2009
30.442
-0.857
-2.74%
jan 1, 2010
29.722
-0.72
-2.37%
jan 1, 2011
29.23
-0.492
-1.66%
jan 1, 2012
28.777
-0.452
-1.55%
jan 1, 2013
28.558
-0.219
-0.76%
jan 1, 2014
28.484
-0.074
-0.26%
jan 1, 2015
28.399
-0.085
-0.3%
jan 1, 2016
28.224
-0.175
-0.62%
Ranking of countries by current statistics by years


Comments: