29
/
en
AIzaSyAYiBZKx7MnpbEhh9jyipgxe19OcubqV5w
April 1, 2024
282777
Vietnam
VNM
true
2
1
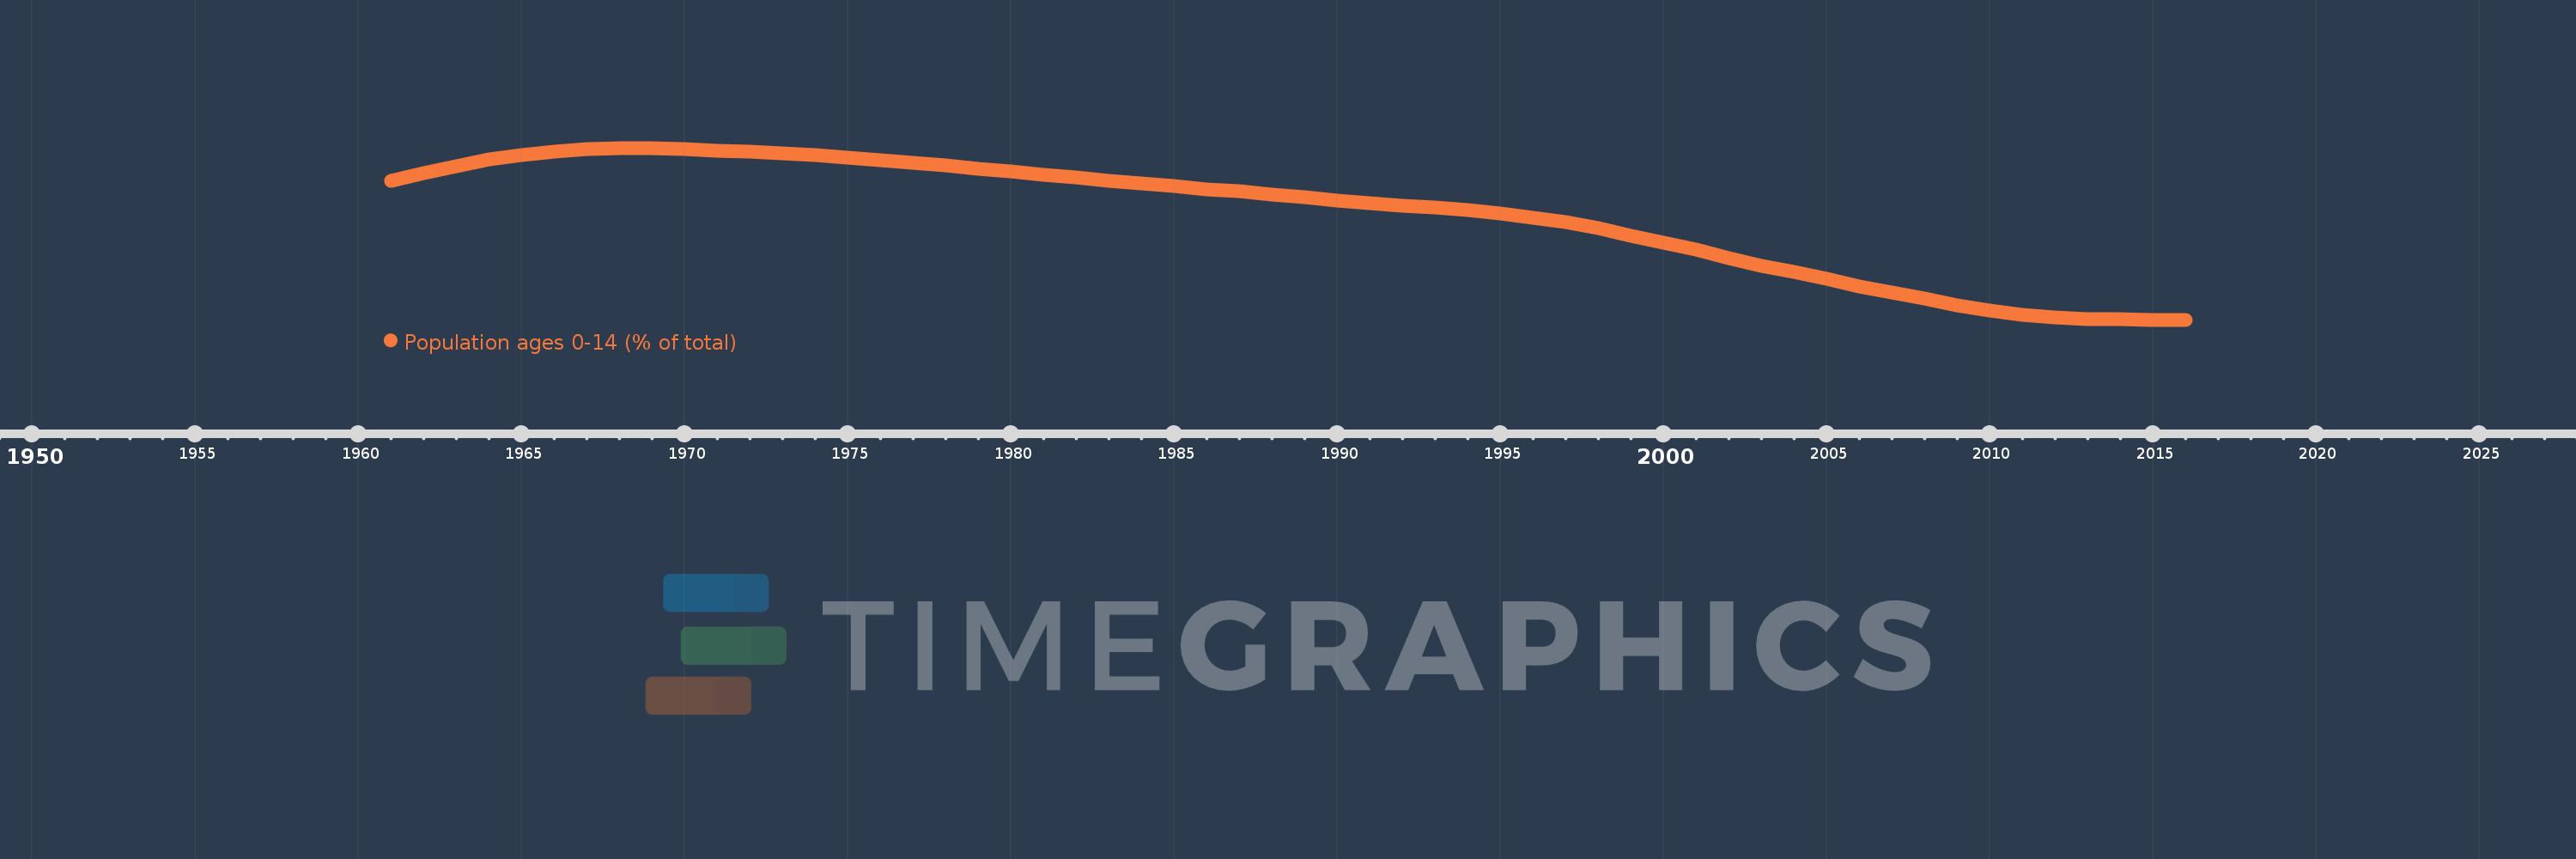
Population ages 0-14 (% of total)
2016,2015,2014,2013,2012,2011,2010,2009,2008,2007,2006,2005,2004,2003,2002,2001,2000,1999,1998,1997,1996,1995,1994,1993,1992,1991,1990,1989,1988,1987,1986,1985,1984,1983,1982,1981,1980,1979,1978,1977,1976,1975,1974,1973,1972,1971,1970,1969,1968,1967,1966,1965,1964,1963,1962,1961
This statistics in other country:
AfghanistanAlbaniaAlgeriaAngolaAntigua and BarbudaArab WorldArgentinaArmeniaArubaAustraliaAustriaAzerbaijanBahamas, TheBahrainBangladeshBarbadosBelarusBelgiumBelizeBeninBhutanBoliviaBosnia and HerzegovinaBotswanaBrazilBrunei DarussalamBulgariaBurkina FasoBurundiCabo VerdeCambodiaCameroonCanadaCaribbean small statesCentral African RepublicCentral Europe and the BalticsChadChannel IslandsChileChinaColombiaComorosCongo, Dem. Rep.Congo, Rep.Costa RicaCote d'IvoireCroatiaCubaCuracaoCyprusCzech RepublicDenmarkDjiboutiDominican RepublicEarly-demographic dividendEast Asia & PacificEast Asia & Pacific (excluding high income)East Asia & Pacific (IDA & IBRD countries)EcuadorEgypt, Arab Rep.El SalvadorEquatorial GuineaEritreaEstoniaEthiopiaEuro areaEurope & Central AsiaEurope & Central Asia (excluding high income)Europe & Central Asia (IDA & IBRD countries)European UnionFijiFinlandFragile and conflict affected situationsFranceFrench PolynesiaGabonGambia, TheGeorgiaGermanyGhanaGreeceGrenadaGuamGuatemalaGuineaGuinea-BissauGuyanaHaitiHeavily indebted poor countries (HIPC)High incomeHondurasHong Kong SAR, ChinaHungaryIBRD onlyIcelandIDA & IBRD totalIDA blendIDA onlyIDA totalIndiaIndonesiaIran, Islamic Rep.IraqIrelandIsraelItalyJamaicaJapanJordanKazakhstanKenyaKiribatiKorea, Dem. People’s Rep.Korea, Rep.KosovoKuwaitKyrgyz RepublicLao PDRLate-demographic dividendLatin America & Caribbean Latin America & Caribbean (excluding high income)Latin America & the Caribbean (IDA & IBRD countries)LatviaLeast developed countries: UN classificationLebanonLesothoLiberiaLibyaLithuaniaLow & middle incomeLow incomeLower middle incomeLuxembourgMacao SAR, ChinaMacedonia, FYRMadagascarMalawiMalaysiaMaldivesMaliMaltaMauritaniaMauritiusMexicoMicronesia, Fed. Sts.Middle East & North AfricaMiddle East & North Africa (excluding high income)Middle East & North Africa (IDA & IBRD countries)Middle incomeMoldovaMongoliaMontenegroMoroccoMozambiqueMyanmarNamibiaNepalNetherlandsNew CaledoniaNew ZealandNicaraguaNigerNigeriaNorth AmericaNorwayOECD membersOmanOther small statesPacific island small statesPakistanPanamaPapua New GuineaParaguayPeruPhilippinesPolandPortugalPost-demographic dividendPre-demographic dividendPuerto RicoQatarRomaniaRussian FederationRwandaSamoaSao Tome and PrincipeSaudi ArabiaSenegalSerbiaSeychellesSierra LeoneSingaporeSlovak RepublicSloveniaSmall statesSolomon IslandsSomaliaSouth AfricaSouth AsiaSouth Asia (IDA & IBRD)South SudanSpainSri LankaSt. LuciaSt. Vincent and the GrenadinesSub-Saharan Africa Sub-Saharan Africa (excluding high income)Sub-Saharan Africa (IDA & IBRD countries)SudanSurinameSwazilandSwedenSwitzerlandSyrian Arab RepublicTajikistanTanzaniaThailandTimor-LesteTogoTongaTrinidad and TobagoTunisiaTurkeyTurkmenistanUgandaUkraineUnited Arab EmiratesUnited KingdomUnited StatesUpper middle incomeUruguayUzbekistanVanuatuVenezuela, RBVietnamVirgin Islands (U.S.)West Bank and GazaWorldYemen, Rep.ZambiaZimbabwe Timeline:
This timeline shows a graph from 1961 to 2016 of Vietnam. No data until 1960. Number of actual observations by date: 56.
Source name:
World Development Indicators
Source organization:
World Bank staff estimates based on age distributions of United Nations Population Division's World Population Prospects.
Categories, topics:
Education, Health
Last updated:
apr 23, 2017
Indicators value changes by year
Maximum:
44.109
jan 1, 1968
At the date of observation
Value
Absolute change
Change from previous value
jan 1, 1961
40.135
+40.135
0.0%
jan 1, 1962
41.023
+0.888
2.21%
jan 1, 1963
41.885
+0.862
2.1%
jan 1, 1964
42.665
+0.78
1.86%
jan 1, 1965
43.282
+0.617
1.45%
jan 1, 1966
43.701
+0.419
0.97%
jan 1, 1967
43.985
+0.285
0.65%
jan 1, 1968
44.109
+0.124
0.28%
jan 1, 1969
44.091
-0.018
-0.04%
jan 1, 1970
43.971
-0.12
-0.27%
jan 1, 1971
43.779
-0.192
-0.44%
jan 1, 1972
43.641
-0.138
-0.32%
jan 1, 1973
43.451
-0.19
-0.44%
jan 1, 1974
43.213
-0.237
-0.55%
jan 1, 1975
42.927
-0.286
-0.66%
jan 1, 1976
42.595
-0.332
-0.77%
jan 1, 1977
42.315
-0.28
-0.66%
jan 1, 1978
41.967
-0.348
-0.82%
jan 1, 1979
41.583
-0.384
-0.91%
jan 1, 1980
41.208
-0.376
-0.9%
jan 1, 1981
40.863
-0.345
-0.84%
jan 1, 1982
40.453
-0.41
-1.0%
jan 1, 1983
40.098
-0.355
-0.88%
jan 1, 1984
39.773
-0.325
-0.81%
jan 1, 1985
39.44
-0.333
-0.84%
jan 1, 1986
39.083
-0.357
-0.91%
jan 1, 1987
38.775
-0.308
-0.79%
jan 1, 1988
38.429
-0.346
-0.89%
jan 1, 1989
38.064
-0.365
-0.95%
jan 1, 1990
37.709
-0.354
-0.93%
jan 1, 1991
37.376
-0.333
-0.88%
jan 1, 1992
37.083
-0.293
-0.78%
jan 1, 1993
36.798
-0.285
-0.77%
jan 1, 1994
36.489
-0.309
-0.84%
jan 1, 1995
36.092
-0.397
-1.09%
jan 1, 1996
35.568
-0.524
-1.45%
jan 1, 1997
35.02
-0.548
-1.54%
jan 1, 1998
34.278
-0.742
-2.12%
jan 1, 1999
33.407
-0.871
-2.54%
jan 1, 2000
32.514
-0.894
-2.67%
jan 1, 2001
31.657
-0.857
-2.63%
jan 1, 2002
30.592
-1.065
-3.37%
jan 1, 2003
29.701
-0.891
-2.91%
jan 1, 2004
28.897
-0.804
-2.71%
jan 1, 2005
28.06
-0.837
-2.9%
jan 1, 2006
27.156
-0.904
-3.22%
jan 1, 2007
26.437
-0.718
-2.65%
jan 1, 2008
25.638
-0.8
-3.02%
jan 1, 2009
24.838
-0.8
-3.12%
jan 1, 2010
24.164
-0.674
-2.71%
jan 1, 2011
23.676
-0.488
-2.02%
jan 1, 2012
23.375
-0.301
-1.27%
jan 1, 2013
23.199
-0.176
-0.75%
jan 1, 2014
23.13
-0.07
-0.3%
jan 1, 2015
23.107
-0.022
-0.1%
jan 1, 2016
23.09
-0.017
-0.08%
Ranking of countries by current statistics by years


Comments: