29
/
en
AIzaSyAYiBZKx7MnpbEhh9jyipgxe19OcubqV5w
April 1, 2024
69169
Antigua and Barbuda
ATG
true
2
1
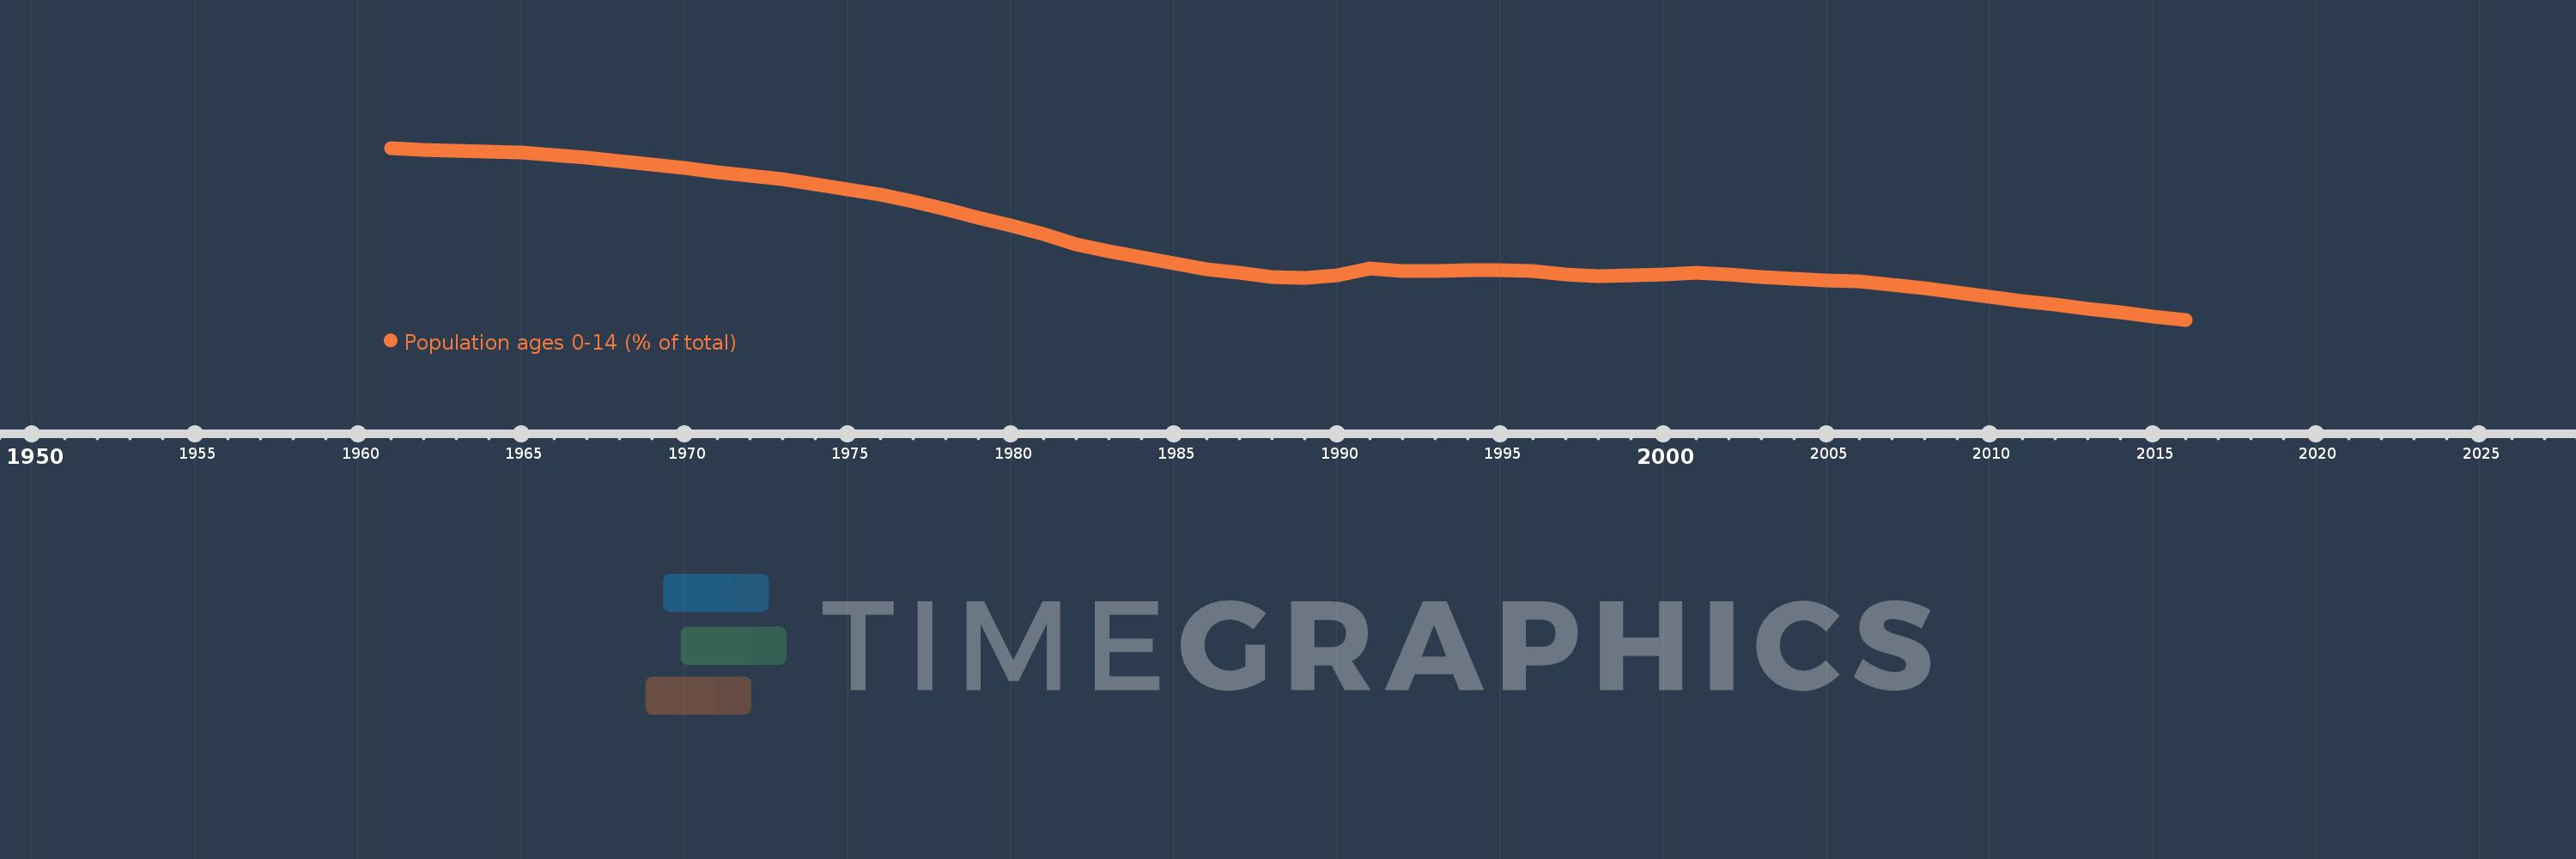
Population ages 0-14 (% of total)
2016,2015,2014,2013,2012,2011,2010,2009,2008,2007,2006,2005,2004,2003,2002,2001,2000,1999,1998,1997,1996,1995,1994,1993,1992,1991,1990,1989,1988,1987,1986,1985,1984,1983,1982,1981,1980,1979,1978,1977,1976,1975,1974,1973,1972,1971,1970,1969,1968,1967,1966,1965,1964,1963,1962,1961
This statistics in other country:
AfghanistanAlbaniaAlgeriaAngolaAntigua and BarbudaArab WorldArgentinaArmeniaArubaAustraliaAustriaAzerbaijanBahamas, TheBahrainBangladeshBarbadosBelarusBelgiumBelizeBeninBhutanBoliviaBosnia and HerzegovinaBotswanaBrazilBrunei DarussalamBulgariaBurkina FasoBurundiCabo VerdeCambodiaCameroonCanadaCaribbean small statesCentral African RepublicCentral Europe and the BalticsChadChannel IslandsChileChinaColombiaComorosCongo, Dem. Rep.Congo, Rep.Costa RicaCote d'IvoireCroatiaCubaCuracaoCyprusCzech RepublicDenmarkDjiboutiDominican RepublicEarly-demographic dividendEast Asia & PacificEast Asia & Pacific (excluding high income)East Asia & Pacific (IDA & IBRD countries)EcuadorEgypt, Arab Rep.El SalvadorEquatorial GuineaEritreaEstoniaEthiopiaEuro areaEurope & Central AsiaEurope & Central Asia (excluding high income)Europe & Central Asia (IDA & IBRD countries)European UnionFijiFinlandFragile and conflict affected situationsFranceFrench PolynesiaGabonGambia, TheGeorgiaGermanyGhanaGreeceGrenadaGuamGuatemalaGuineaGuinea-BissauGuyanaHaitiHeavily indebted poor countries (HIPC)High incomeHondurasHong Kong SAR, ChinaHungaryIBRD onlyIcelandIDA & IBRD totalIDA blendIDA onlyIDA totalIndiaIndonesiaIran, Islamic Rep.IraqIrelandIsraelItalyJamaicaJapanJordanKazakhstanKenyaKiribatiKorea, Dem. People’s Rep.Korea, Rep.KosovoKuwaitKyrgyz RepublicLao PDRLate-demographic dividendLatin America & Caribbean Latin America & Caribbean (excluding high income)Latin America & the Caribbean (IDA & IBRD countries)LatviaLeast developed countries: UN classificationLebanonLesothoLiberiaLibyaLithuaniaLow & middle incomeLow incomeLower middle incomeLuxembourgMacao SAR, ChinaMacedonia, FYRMadagascarMalawiMalaysiaMaldivesMaliMaltaMauritaniaMauritiusMexicoMicronesia, Fed. Sts.Middle East & North AfricaMiddle East & North Africa (excluding high income)Middle East & North Africa (IDA & IBRD countries)Middle incomeMoldovaMongoliaMontenegroMoroccoMozambiqueMyanmarNamibiaNepalNetherlandsNew CaledoniaNew ZealandNicaraguaNigerNigeriaNorth AmericaNorwayOECD membersOmanOther small statesPacific island small statesPakistanPanamaPapua New GuineaParaguayPeruPhilippinesPolandPortugalPost-demographic dividendPre-demographic dividendPuerto RicoQatarRomaniaRussian FederationRwandaSamoaSao Tome and PrincipeSaudi ArabiaSenegalSerbiaSeychellesSierra LeoneSingaporeSlovak RepublicSloveniaSmall statesSolomon IslandsSomaliaSouth AfricaSouth AsiaSouth Asia (IDA & IBRD)South SudanSpainSri LankaSt. LuciaSt. Vincent and the GrenadinesSub-Saharan Africa Sub-Saharan Africa (excluding high income)Sub-Saharan Africa (IDA & IBRD countries)SudanSurinameSwazilandSwedenSwitzerlandSyrian Arab RepublicTajikistanTanzaniaThailandTimor-LesteTogoTongaTrinidad and TobagoTunisiaTurkeyTurkmenistanUgandaUkraineUnited Arab EmiratesUnited KingdomUnited StatesUpper middle incomeUruguayUzbekistanVanuatuVenezuela, RBVietnamVirgin Islands (U.S.)West Bank and GazaWorldYemen, Rep.ZambiaZimbabwe Timeline:
This timeline shows a graph from 1961 to 2016 of Antigua and Barbuda. No data until 1960. Number of actual observations by date: 56.
Source name:
World Development Indicators
Source organization:
World Bank staff estimates based on age distributions of United Nations Population Division's World Population Prospects.
Categories, topics:
Education, Health
Last updated:
apr 23, 2017
Indicators value changes by year
Minimum:
24.178
jan 1, 2016
Maximum:
42.742
jan 1, 1961
At the date of observation
Value
Absolute change
Change from previous value
jan 1, 1961
42.742
+42.742
0.0%
jan 1, 1962
42.548
-0.194
-0.45%
jan 1, 1963
42.429
-0.12
-0.28%
jan 1, 1964
42.339
-0.09
-0.21%
jan 1, 1965
42.212
-0.127
-0.3%
jan 1, 1966
42.016
-0.196
-0.46%
jan 1, 1967
41.657
-0.359
-0.86%
jan 1, 1968
41.31
-0.347
-0.83%
jan 1, 1969
40.949
-0.361
-0.87%
jan 1, 1970
40.562
-0.387
-0.95%
jan 1, 1971
40.128
-0.434
-1.07%
jan 1, 1972
39.771
-0.357
-0.89%
jan 1, 1973
39.33
-0.44
-1.11%
jan 1, 1974
38.835
-0.495
-1.26%
jan 1, 1975
38.305
-0.531
-1.37%
jan 1, 1976
37.728
-0.576
-1.5%
jan 1, 1977
36.967
-0.762
-2.02%
jan 1, 1978
36.121
-0.846
-2.29%
jan 1, 1979
35.217
-0.903
-2.5%
jan 1, 1980
34.315
-0.903
-2.56%
jan 1, 1981
33.448
-0.867
-2.53%
jan 1, 1982
32.356
-1.092
-3.26%
jan 1, 1983
31.537
-0.818
-2.53%
jan 1, 1984
30.894
-0.643
-2.04%
jan 1, 1985
30.278
-0.616
-1.99%
jan 1, 1986
29.667
-0.612
-2.02%
jan 1, 1987
29.245
-0.421
-1.42%
jan 1, 1988
28.829
-0.416
-1.42%
jan 1, 1989
28.659
-0.17
-0.59%
jan 1, 1990
28.956
+0.296
1.03%
jan 1, 1991
29.697
+0.741
2.56%
jan 1, 1992
29.465
-0.231
-0.78%
jan 1, 1993
29.459
-0.007
-0.02%
jan 1, 1994
29.529
+0.07
0.24%
jan 1, 1995
29.527
-0.003
-0.01%
jan 1, 1996
29.42
-0.107
-0.36%
jan 1, 1997
29.094
-0.326
-1.11%
jan 1, 1998
28.929
-0.165
-0.57%
jan 1, 1999
28.94
+0.011
0.04%
jan 1, 2000
29.074
+0.134
0.46%
jan 1, 2001
29.219
+0.145
0.5%
jan 1, 2002
29.06
-0.159
-0.55%
jan 1, 2003
28.832
-0.228
-0.78%
jan 1, 2004
28.61
-0.221
-0.77%
jan 1, 2005
28.449
-0.161
-0.56%
jan 1, 2006
28.328
-0.121
-0.43%
jan 1, 2007
27.985
-0.343
-1.21%
jan 1, 2008
27.586
-0.398
-1.42%
jan 1, 2009
27.151
-0.436
-1.58%
jan 1, 2010
26.693
-0.458
-1.69%
jan 1, 2011
26.233
-0.46
-1.72%
jan 1, 2012
25.797
-0.436
-1.66%
jan 1, 2013
25.368
-0.43
-1.66%
jan 1, 2014
24.951
-0.417
-1.64%
jan 1, 2015
24.554
-0.396
-1.59%
jan 1, 2016
24.178
-0.376
-1.53%
Ranking of countries by current statistics by years


Comments: