29
/
en
AIzaSyAYiBZKx7MnpbEhh9jyipgxe19OcubqV5w
April 1, 2024
116495
Curacao
CUW
true
2
1
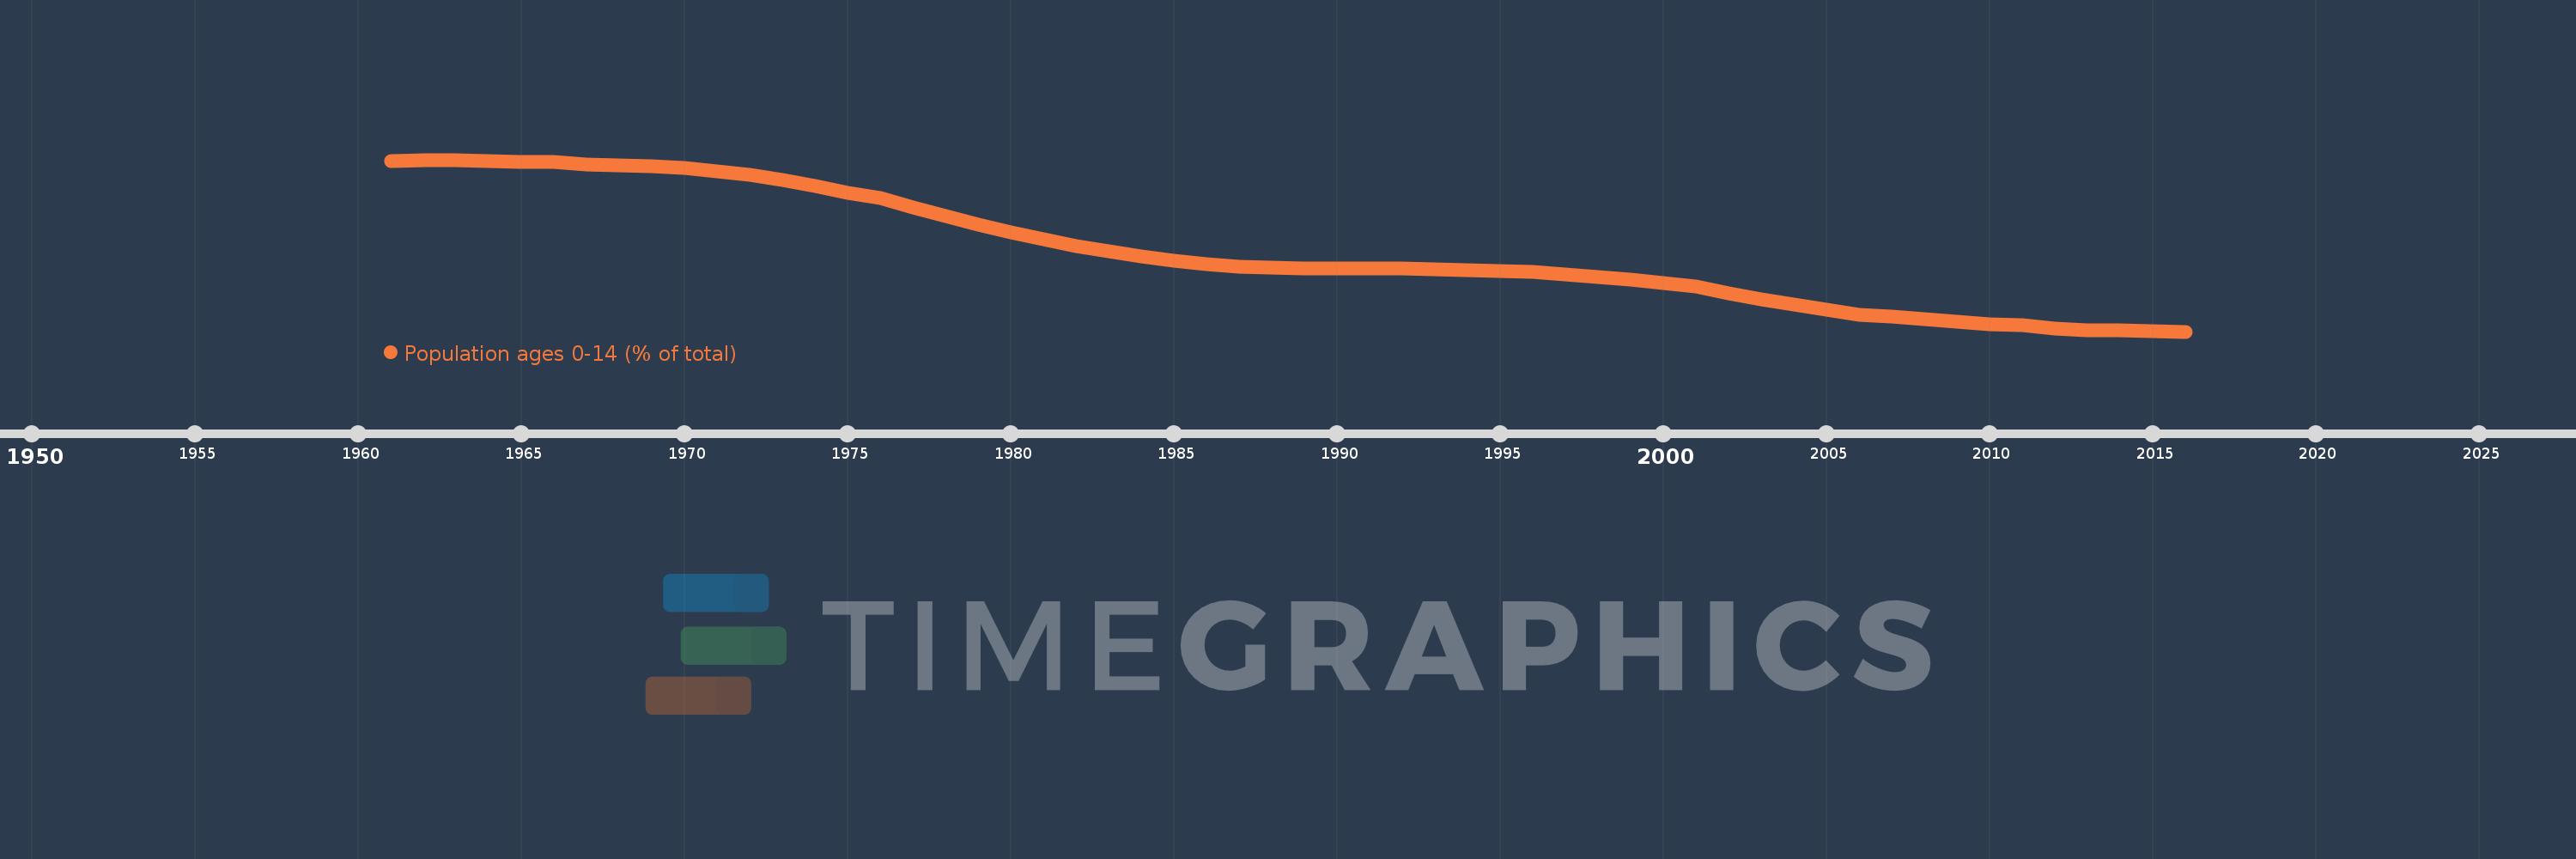
Population ages 0-14 (% of total)
2016,2015,2014,2013,2012,2011,2010,2009,2008,2007,2006,2005,2004,2003,2002,2001,2000,1999,1998,1997,1996,1995,1994,1993,1992,1991,1990,1989,1988,1987,1986,1985,1984,1983,1982,1981,1980,1979,1978,1977,1976,1975,1974,1973,1972,1971,1970,1969,1968,1967,1966,1965,1964,1963,1962,1961
This statistics in other country:
AfghanistanAlbaniaAlgeriaAngolaAntigua and BarbudaArab WorldArgentinaArmeniaArubaAustraliaAustriaAzerbaijanBahamas, TheBahrainBangladeshBarbadosBelarusBelgiumBelizeBeninBhutanBoliviaBosnia and HerzegovinaBotswanaBrazilBrunei DarussalamBulgariaBurkina FasoBurundiCabo VerdeCambodiaCameroonCanadaCaribbean small statesCentral African RepublicCentral Europe and the BalticsChadChannel IslandsChileChinaColombiaComorosCongo, Dem. Rep.Congo, Rep.Costa RicaCote d'IvoireCroatiaCubaCuracaoCyprusCzech RepublicDenmarkDjiboutiDominican RepublicEarly-demographic dividendEast Asia & PacificEast Asia & Pacific (excluding high income)East Asia & Pacific (IDA & IBRD countries)EcuadorEgypt, Arab Rep.El SalvadorEquatorial GuineaEritreaEstoniaEthiopiaEuro areaEurope & Central AsiaEurope & Central Asia (excluding high income)Europe & Central Asia (IDA & IBRD countries)European UnionFijiFinlandFragile and conflict affected situationsFranceFrench PolynesiaGabonGambia, TheGeorgiaGermanyGhanaGreeceGrenadaGuamGuatemalaGuineaGuinea-BissauGuyanaHaitiHeavily indebted poor countries (HIPC)High incomeHondurasHong Kong SAR, ChinaHungaryIBRD onlyIcelandIDA & IBRD totalIDA blendIDA onlyIDA totalIndiaIndonesiaIran, Islamic Rep.IraqIrelandIsraelItalyJamaicaJapanJordanKazakhstanKenyaKiribatiKorea, Dem. People’s Rep.Korea, Rep.KosovoKuwaitKyrgyz RepublicLao PDRLate-demographic dividendLatin America & Caribbean Latin America & Caribbean (excluding high income)Latin America & the Caribbean (IDA & IBRD countries)LatviaLeast developed countries: UN classificationLebanonLesothoLiberiaLibyaLithuaniaLow & middle incomeLow incomeLower middle incomeLuxembourgMacao SAR, ChinaMacedonia, FYRMadagascarMalawiMalaysiaMaldivesMaliMaltaMauritaniaMauritiusMexicoMicronesia, Fed. Sts.Middle East & North AfricaMiddle East & North Africa (excluding high income)Middle East & North Africa (IDA & IBRD countries)Middle incomeMoldovaMongoliaMontenegroMoroccoMozambiqueMyanmarNamibiaNepalNetherlandsNew CaledoniaNew ZealandNicaraguaNigerNigeriaNorth AmericaNorwayOECD membersOmanOther small statesPacific island small statesPakistanPanamaPapua New GuineaParaguayPeruPhilippinesPolandPortugalPost-demographic dividendPre-demographic dividendPuerto RicoQatarRomaniaRussian FederationRwandaSamoaSao Tome and PrincipeSaudi ArabiaSenegalSerbiaSeychellesSierra LeoneSingaporeSlovak RepublicSloveniaSmall statesSolomon IslandsSomaliaSouth AfricaSouth AsiaSouth Asia (IDA & IBRD)South SudanSpainSri LankaSt. LuciaSt. Vincent and the GrenadinesSub-Saharan Africa Sub-Saharan Africa (excluding high income)Sub-Saharan Africa (IDA & IBRD countries)SudanSurinameSwazilandSwedenSwitzerlandSyrian Arab RepublicTajikistanTanzaniaThailandTimor-LesteTogoTongaTrinidad and TobagoTunisiaTurkeyTurkmenistanUgandaUkraineUnited Arab EmiratesUnited KingdomUnited StatesUpper middle incomeUruguayUzbekistanVanuatuVenezuela, RBVietnamVirgin Islands (U.S.)West Bank and GazaWorldYemen, Rep.ZambiaZimbabwe Timeline:
This timeline shows a graph from 1961 to 2016 of Curacao. No data until 1960. Number of actual observations by date: 56.
Source name:
World Development Indicators
Source organization:
World Bank staff estimates based on age distributions of United Nations Population Division's World Population Prospects.
Categories, topics:
Education, Health
Last updated:
apr 23, 2017
Indicators value changes by year
Minimum:
18.976
jan 1, 2016
At the date of observation
Value
Absolute change
Change from previous value
jan 1, 1961
41.223
+41.223
0.0%
jan 1, 1962
41.37
+0.147
0.36%
jan 1, 1963
41.328
-0.041
-0.1%
jan 1, 1964
41.213
-0.116
-0.28%
jan 1, 1965
41.129
-0.083
-0.2%
jan 1, 1966
41.104
-0.025
-0.06%
jan 1, 1967
40.777
-0.327
-0.8%
jan 1, 1968
40.63
-0.147
-0.36%
jan 1, 1969
40.532
-0.098
-0.24%
jan 1, 1970
40.292
-0.24
-0.59%
jan 1, 1971
39.806
-0.486
-1.21%
jan 1, 1972
39.421
-0.385
-0.97%
jan 1, 1973
38.753
-0.668
-1.69%
jan 1, 1974
37.915
-0.838
-2.16%
jan 1, 1975
37.1
-0.815
-2.15%
jan 1, 1976
36.391
-0.71
-1.91%
jan 1, 1977
35.157
-1.233
-3.39%
jan 1, 1978
34.02
-1.138
-3.24%
jan 1, 1979
32.952
-1.068
-3.14%
jan 1, 1980
31.939
-1.013
-3.07%
jan 1, 1981
31.01
-0.929
-2.91%
jan 1, 1982
30.126
-0.884
-2.85%
jan 1, 1983
29.428
-0.699
-2.32%
jan 1, 1984
28.825
-0.603
-2.05%
jan 1, 1985
28.262
-0.563
-1.95%
jan 1, 1986
27.737
-0.525
-1.86%
jan 1, 1987
27.443
-0.293
-1.06%
jan 1, 1988
27.282
-0.162
-0.59%
jan 1, 1989
27.209
-0.073
-0.27%
jan 1, 1990
27.201
-0.008
-0.03%
jan 1, 1991
27.241
+0.04
0.15%
jan 1, 1992
27.165
-0.077
-0.28%
jan 1, 1993
27.097
-0.068
-0.25%
jan 1, 1994
27.008
-0.089
-0.33%
jan 1, 1995
26.896
-0.113
-0.42%
jan 1, 1996
26.759
-0.137
-0.51%
jan 1, 1997
26.417
-0.342
-1.28%
jan 1, 1998
26.08
-0.336
-1.27%
jan 1, 1999
25.699
-0.381
-1.46%
jan 1, 2000
25.285
-0.414
-1.61%
jan 1, 2001
24.898
-0.387
-1.53%
jan 1, 2002
23.936
-0.962
-3.86%
jan 1, 2003
23.171
-0.766
-3.2%
jan 1, 2004
22.486
-0.684
-2.95%
jan 1, 2005
21.792
-0.694
-3.09%
jan 1, 2006
21.11
-0.682
-3.13%
jan 1, 2007
20.89
-0.22
-1.04%
jan 1, 2008
20.568
-0.322
-1.54%
jan 1, 2009
20.218
-0.351
-1.7%
jan 1, 2010
19.967
-0.251
-1.24%
jan 1, 2011
19.857
-0.109
-0.55%
jan 1, 2012
19.385
-0.472
-2.38%
jan 1, 2013
19.17
-0.215
-1.11%
jan 1, 2014
19.109
-0.061
-0.32%
jan 1, 2015
19.066
-0.044
-0.23%
jan 1, 2016
18.976
-0.089
-0.47%
Ranking of countries by current statistics by years


Comments: