29
/
en
AIzaSyAYiBZKx7MnpbEhh9jyipgxe19OcubqV5w
April 1, 2024
283299
Virgin Islands (U.S.)
VIR
true
2
1
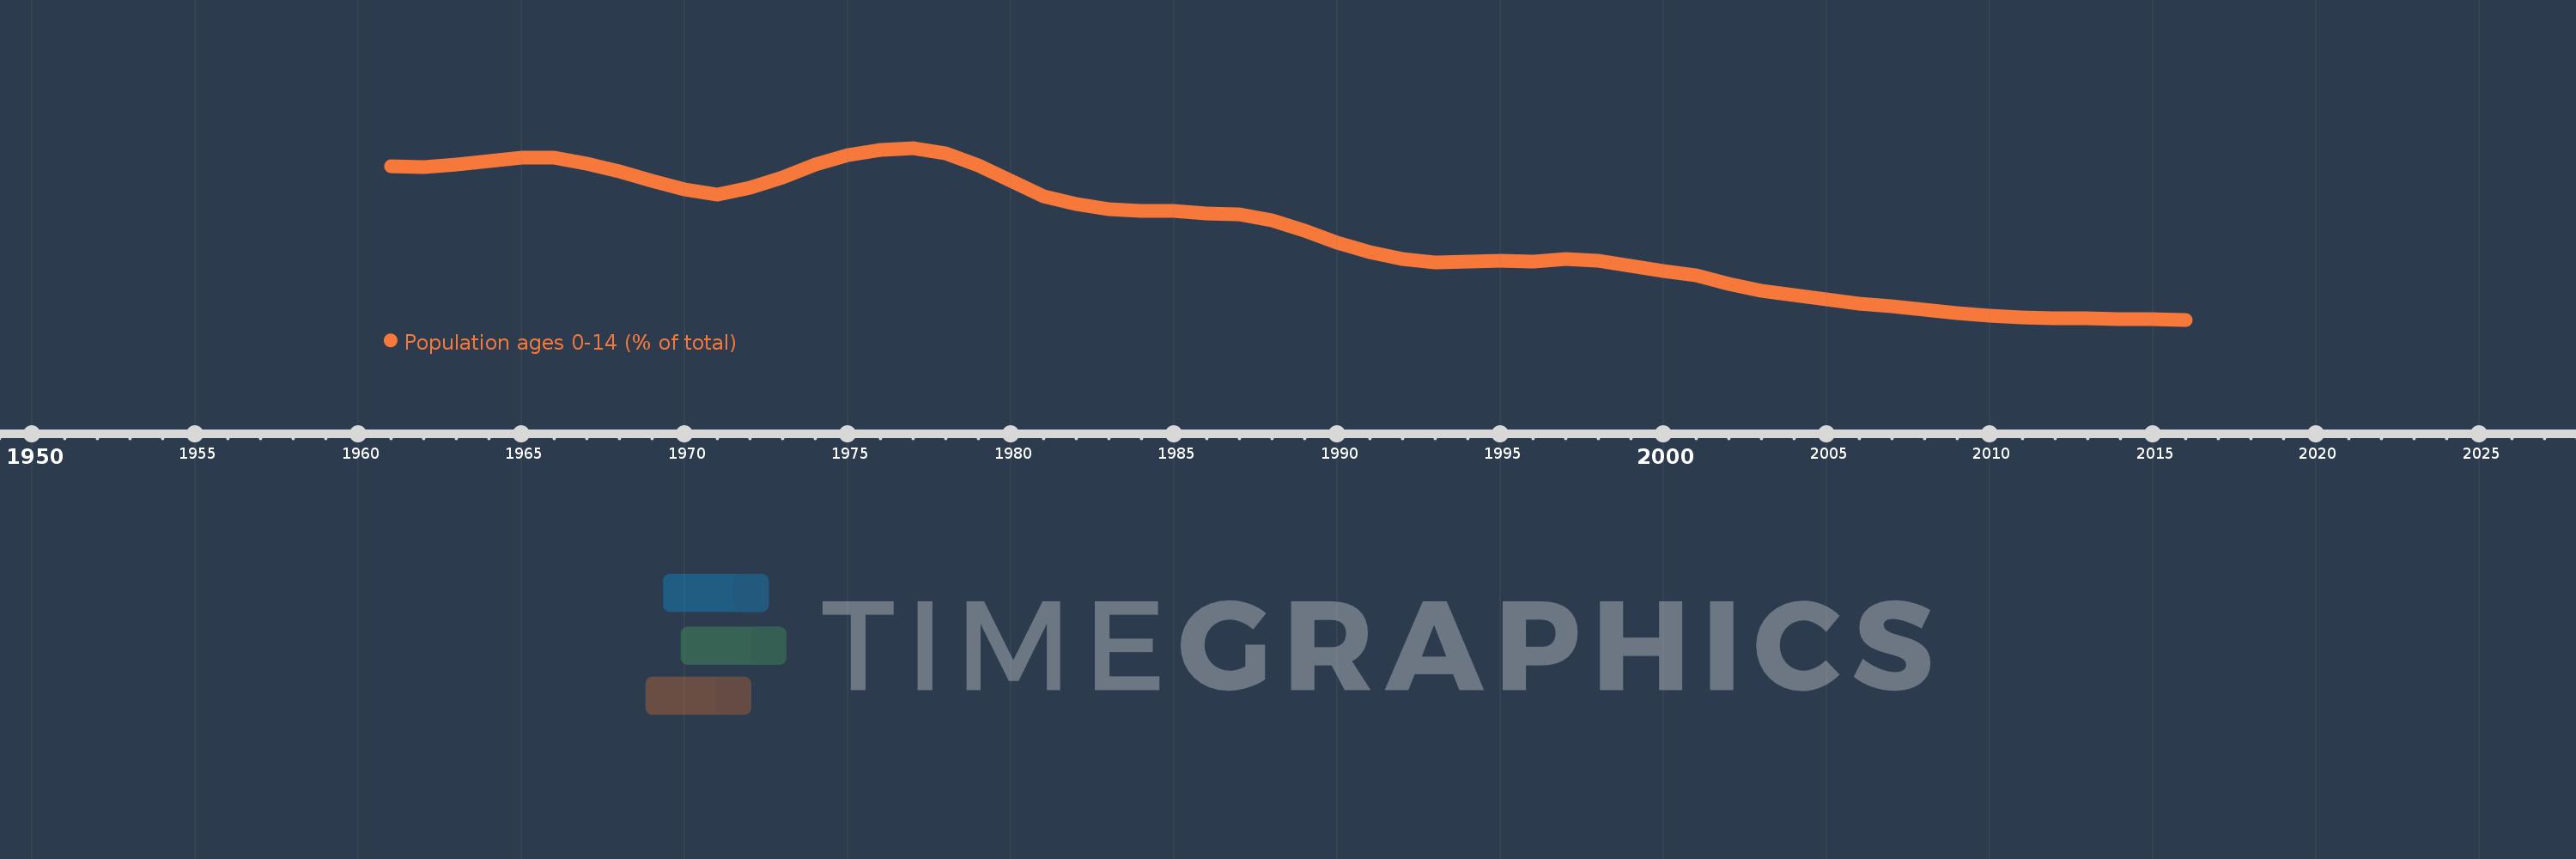
Population ages 0-14 (% of total)
2016,2015,2014,2013,2012,2011,2010,2009,2008,2007,2006,2005,2004,2003,2002,2001,2000,1999,1998,1997,1996,1995,1994,1993,1992,1991,1990,1989,1988,1987,1986,1985,1984,1983,1982,1981,1980,1979,1978,1977,1976,1975,1974,1973,1972,1971,1970,1969,1968,1967,1966,1965,1964,1963,1962,1961
This statistics in other country:
AfghanistanAlbaniaAlgeriaAngolaAntigua and BarbudaArab WorldArgentinaArmeniaArubaAustraliaAustriaAzerbaijanBahamas, TheBahrainBangladeshBarbadosBelarusBelgiumBelizeBeninBhutanBoliviaBosnia and HerzegovinaBotswanaBrazilBrunei DarussalamBulgariaBurkina FasoBurundiCabo VerdeCambodiaCameroonCanadaCaribbean small statesCentral African RepublicCentral Europe and the BalticsChadChannel IslandsChileChinaColombiaComorosCongo, Dem. Rep.Congo, Rep.Costa RicaCote d'IvoireCroatiaCubaCuracaoCyprusCzech RepublicDenmarkDjiboutiDominican RepublicEarly-demographic dividendEast Asia & PacificEast Asia & Pacific (excluding high income)East Asia & Pacific (IDA & IBRD countries)EcuadorEgypt, Arab Rep.El SalvadorEquatorial GuineaEritreaEstoniaEthiopiaEuro areaEurope & Central AsiaEurope & Central Asia (excluding high income)Europe & Central Asia (IDA & IBRD countries)European UnionFijiFinlandFragile and conflict affected situationsFranceFrench PolynesiaGabonGambia, TheGeorgiaGermanyGhanaGreeceGrenadaGuamGuatemalaGuineaGuinea-BissauGuyanaHaitiHeavily indebted poor countries (HIPC)High incomeHondurasHong Kong SAR, ChinaHungaryIBRD onlyIcelandIDA & IBRD totalIDA blendIDA onlyIDA totalIndiaIndonesiaIran, Islamic Rep.IraqIrelandIsraelItalyJamaicaJapanJordanKazakhstanKenyaKiribatiKorea, Dem. People’s Rep.Korea, Rep.KosovoKuwaitKyrgyz RepublicLao PDRLate-demographic dividendLatin America & Caribbean Latin America & Caribbean (excluding high income)Latin America & the Caribbean (IDA & IBRD countries)LatviaLeast developed countries: UN classificationLebanonLesothoLiberiaLibyaLithuaniaLow & middle incomeLow incomeLower middle incomeLuxembourgMacao SAR, ChinaMacedonia, FYRMadagascarMalawiMalaysiaMaldivesMaliMaltaMauritaniaMauritiusMexicoMicronesia, Fed. Sts.Middle East & North AfricaMiddle East & North Africa (excluding high income)Middle East & North Africa (IDA & IBRD countries)Middle incomeMoldovaMongoliaMontenegroMoroccoMozambiqueMyanmarNamibiaNepalNetherlandsNew CaledoniaNew ZealandNicaraguaNigerNigeriaNorth AmericaNorwayOECD membersOmanOther small statesPacific island small statesPakistanPanamaPapua New GuineaParaguayPeruPhilippinesPolandPortugalPost-demographic dividendPre-demographic dividendPuerto RicoQatarRomaniaRussian FederationRwandaSamoaSao Tome and PrincipeSaudi ArabiaSenegalSerbiaSeychellesSierra LeoneSingaporeSlovak RepublicSloveniaSmall statesSolomon IslandsSomaliaSouth AfricaSouth AsiaSouth Asia (IDA & IBRD)South SudanSpainSri LankaSt. LuciaSt. Vincent and the GrenadinesSub-Saharan Africa Sub-Saharan Africa (excluding high income)Sub-Saharan Africa (IDA & IBRD countries)SudanSurinameSwazilandSwedenSwitzerlandSyrian Arab RepublicTajikistanTanzaniaThailandTimor-LesteTogoTongaTrinidad and TobagoTunisiaTurkeyTurkmenistanUgandaUkraineUnited Arab EmiratesUnited KingdomUnited StatesUpper middle incomeUruguayUzbekistanVanuatuVenezuela, RBVietnamVirgin Islands (U.S.)West Bank and GazaWorldYemen, Rep.ZambiaZimbabwe Timeline:
This timeline shows a graph from 1961 to 2016 of Virgin Islands (U.S.). No data until 1960. Number of actual observations by date: 56.
Source name:
World Development Indicators
Source organization:
World Bank staff estimates based on age distributions of United Nations Population Division's World Population Prospects.
Categories, topics:
Education, Health
Last updated:
apr 23, 2017
Indicators value changes by year
Minimum:
20.361
jan 1, 2016
Maximum:
42.029
jan 1, 1977
At the date of observation
Value
Absolute change
Change from previous value
jan 1, 1961
39.682
+39.682
0.0%
jan 1, 1962
39.644
-0.038
-0.1%
jan 1, 1963
39.901
+0.257
0.65%
jan 1, 1964
40.405
+0.504
1.26%
jan 1, 1965
40.803
+0.398
0.98%
jan 1, 1966
40.794
-0.008
-0.02%
jan 1, 1967
40.082
-0.712
-1.74%
jan 1, 1968
39.073
-1.009
-2.52%
jan 1, 1969
37.866
-1.208
-3.09%
jan 1, 1970
36.77
-1.096
-2.89%
jan 1, 1971
36.101
-0.669
-1.82%
jan 1, 1972
37.024
+0.923
2.56%
jan 1, 1973
38.339
+1.315
3.55%
jan 1, 1974
39.885
+1.546
4.03%
jan 1, 1975
41.177
+1.293
3.24%
jan 1, 1976
41.779
+0.601
1.46%
jan 1, 1977
42.029
+0.25
0.6%
jan 1, 1978
41.364
-0.665
-1.58%
jan 1, 1979
39.851
-1.513
-3.66%
jan 1, 1980
37.903
-1.948
-4.89%
jan 1, 1981
35.967
-1.936
-5.11%
jan 1, 1982
34.905
-1.063
-2.95%
jan 1, 1983
34.265
-0.64
-1.83%
jan 1, 1984
34.09
-0.175
-0.51%
jan 1, 1985
34.045
-0.044
-0.13%
jan 1, 1986
33.752
-0.293
-0.86%
jan 1, 1987
33.64
-0.113
-0.33%
jan 1, 1988
32.88
-0.76
-2.26%
jan 1, 1989
31.561
-1.319
-4.01%
jan 1, 1990
30.102
-1.459
-4.62%
jan 1, 1991
28.89
-1.212
-4.02%
jan 1, 1992
28.01
-0.88
-3.05%
jan 1, 1993
27.639
-0.371
-1.32%
jan 1, 1994
27.707
+0.069
0.25%
jan 1, 1995
27.821
+0.113
0.41%
jan 1, 1996
27.663
-0.158
-0.57%
jan 1, 1997
28.005
+0.342
1.24%
jan 1, 1998
27.807
-0.198
-0.71%
jan 1, 1999
27.198
-0.608
-2.19%
jan 1, 2000
26.501
-0.698
-2.57%
jan 1, 2001
25.919
-0.582
-2.2%
jan 1, 2002
24.862
-1.057
-4.08%
jan 1, 2003
24.032
-0.829
-3.34%
jan 1, 2004
23.437
-0.595
-2.47%
jan 1, 2005
22.933
-0.504
-2.15%
jan 1, 2006
22.419
-0.514
-2.24%
jan 1, 2007
22.027
-0.391
-1.75%
jan 1, 2008
21.623
-0.405
-1.84%
jan 1, 2009
21.225
-0.397
-1.84%
jan 1, 2010
20.899
-0.326
-1.54%
jan 1, 2011
20.679
-0.22
-1.05%
jan 1, 2012
20.585
-0.095
-0.46%
jan 1, 2013
20.505
-0.08
-0.39%
jan 1, 2014
20.444
-0.061
-0.3%
jan 1, 2015
20.397
-0.048
-0.23%
jan 1, 2016
20.361
-0.036
-0.17%
Ranking of countries by current statistics by years


Comments: