29
/
en
AIzaSyAYiBZKx7MnpbEhh9jyipgxe19OcubqV5w
April 1, 2024
114077
Cote d'Ivoire
CIV
true
2
1
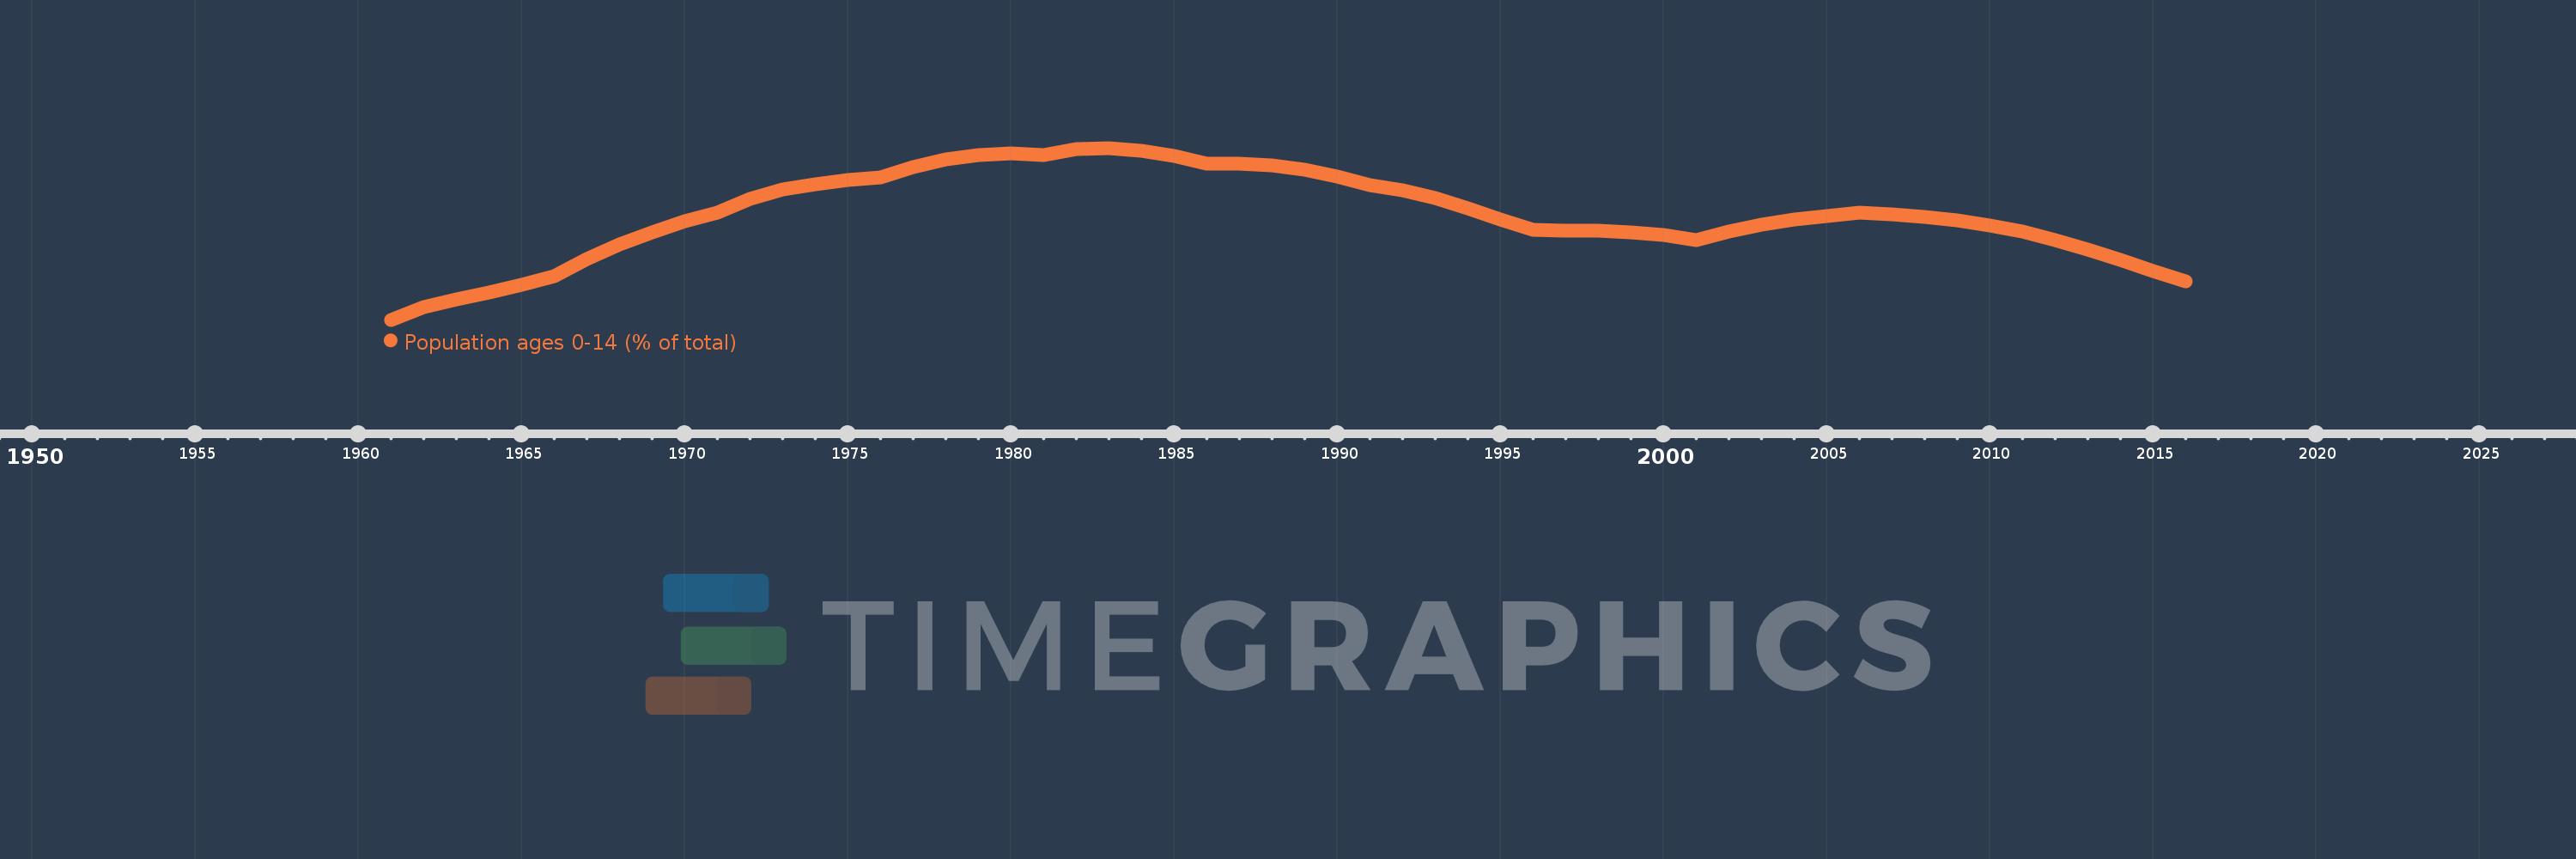
Population ages 0-14 (% of total)
2016,2015,2014,2013,2012,2011,2010,2009,2008,2007,2006,2005,2004,2003,2002,2001,2000,1999,1998,1997,1996,1995,1994,1993,1992,1991,1990,1989,1988,1987,1986,1985,1984,1983,1982,1981,1980,1979,1978,1977,1976,1975,1974,1973,1972,1971,1970,1969,1968,1967,1966,1965,1964,1963,1962,1961
This statistics in other country:
AfghanistanAlbaniaAlgeriaAngolaAntigua and BarbudaArab WorldArgentinaArmeniaArubaAustraliaAustriaAzerbaijanBahamas, TheBahrainBangladeshBarbadosBelarusBelgiumBelizeBeninBhutanBoliviaBosnia and HerzegovinaBotswanaBrazilBrunei DarussalamBulgariaBurkina FasoBurundiCabo VerdeCambodiaCameroonCanadaCaribbean small statesCentral African RepublicCentral Europe and the BalticsChadChannel IslandsChileChinaColombiaComorosCongo, Dem. Rep.Congo, Rep.Costa RicaCote d'IvoireCroatiaCubaCuracaoCyprusCzech RepublicDenmarkDjiboutiDominican RepublicEarly-demographic dividendEast Asia & PacificEast Asia & Pacific (excluding high income)East Asia & Pacific (IDA & IBRD countries)EcuadorEgypt, Arab Rep.El SalvadorEquatorial GuineaEritreaEstoniaEthiopiaEuro areaEurope & Central AsiaEurope & Central Asia (excluding high income)Europe & Central Asia (IDA & IBRD countries)European UnionFijiFinlandFragile and conflict affected situationsFranceFrench PolynesiaGabonGambia, TheGeorgiaGermanyGhanaGreeceGrenadaGuamGuatemalaGuineaGuinea-BissauGuyanaHaitiHeavily indebted poor countries (HIPC)High incomeHondurasHong Kong SAR, ChinaHungaryIBRD onlyIcelandIDA & IBRD totalIDA blendIDA onlyIDA totalIndiaIndonesiaIran, Islamic Rep.IraqIrelandIsraelItalyJamaicaJapanJordanKazakhstanKenyaKiribatiKorea, Dem. People’s Rep.Korea, Rep.KosovoKuwaitKyrgyz RepublicLao PDRLate-demographic dividendLatin America & Caribbean Latin America & Caribbean (excluding high income)Latin America & the Caribbean (IDA & IBRD countries)LatviaLeast developed countries: UN classificationLebanonLesothoLiberiaLibyaLithuaniaLow & middle incomeLow incomeLower middle incomeLuxembourgMacao SAR, ChinaMacedonia, FYRMadagascarMalawiMalaysiaMaldivesMaliMaltaMauritaniaMauritiusMexicoMicronesia, Fed. Sts.Middle East & North AfricaMiddle East & North Africa (excluding high income)Middle East & North Africa (IDA & IBRD countries)Middle incomeMoldovaMongoliaMontenegroMoroccoMozambiqueMyanmarNamibiaNepalNetherlandsNew CaledoniaNew ZealandNicaraguaNigerNigeriaNorth AmericaNorwayOECD membersOmanOther small statesPacific island small statesPakistanPanamaPapua New GuineaParaguayPeruPhilippinesPolandPortugalPost-demographic dividendPre-demographic dividendPuerto RicoQatarRomaniaRussian FederationRwandaSamoaSao Tome and PrincipeSaudi ArabiaSenegalSerbiaSeychellesSierra LeoneSingaporeSlovak RepublicSloveniaSmall statesSolomon IslandsSomaliaSouth AfricaSouth AsiaSouth Asia (IDA & IBRD)South SudanSpainSri LankaSt. LuciaSt. Vincent and the GrenadinesSub-Saharan Africa Sub-Saharan Africa (excluding high income)Sub-Saharan Africa (IDA & IBRD countries)SudanSurinameSwazilandSwedenSwitzerlandSyrian Arab RepublicTajikistanTanzaniaThailandTimor-LesteTogoTongaTrinidad and TobagoTunisiaTurkeyTurkmenistanUgandaUkraineUnited Arab EmiratesUnited KingdomUnited StatesUpper middle incomeUruguayUzbekistanVanuatuVenezuela, RBVietnamVirgin Islands (U.S.)West Bank and GazaWorldYemen, Rep.ZambiaZimbabwe Timeline:
This timeline shows a graph from 1961 to 2016 of Cote d'Ivoire. No data until 1960. Number of actual observations by date: 56.
Source name:
World Development Indicators
Source organization:
World Bank staff estimates based on age distributions of United Nations Population Division's World Population Prospects.
Categories, topics:
Education, Health
Last updated:
apr 23, 2017
Indicators value changes by year
Minimum:
41.573
jan 1, 1961
Maximum:
45.616
jan 1, 1983
At the date of observation
Value
Absolute change
Change from previous value
jan 1, 1961
41.573
+41.573
0.0%
jan 1, 1962
41.865
+0.291
0.7%
jan 1, 1963
42.057
+0.193
0.46%
jan 1, 1964
42.212
+0.155
0.37%
jan 1, 1965
42.387
+0.175
0.42%
jan 1, 1966
42.608
+0.221
0.52%
jan 1, 1967
42.999
+0.391
0.92%
jan 1, 1968
43.339
+0.34
0.79%
jan 1, 1969
43.638
+0.299
0.69%
jan 1, 1970
43.89
+0.252
0.58%
jan 1, 1971
44.101
+0.211
0.48%
jan 1, 1972
44.42
+0.319
0.72%
jan 1, 1973
44.633
+0.213
0.48%
jan 1, 1974
44.769
+0.136
0.3%
jan 1, 1975
44.856
+0.086
0.19%
jan 1, 1976
44.914
+0.059
0.13%
jan 1, 1977
45.171
+0.257
0.57%
jan 1, 1978
45.346
+0.175
0.39%
jan 1, 1979
45.451
+0.105
0.23%
jan 1, 1980
45.485
+0.034
0.08%
jan 1, 1981
45.455
-0.03
-0.07%
jan 1, 1982
45.597
+0.141
0.31%
jan 1, 1983
45.616
+0.019
0.04%
jan 1, 1984
45.546
-0.07
-0.15%
jan 1, 1985
45.419
-0.127
-0.28%
jan 1, 1986
45.252
-0.167
-0.37%
jan 1, 1987
45.256
+0.003
0.01%
jan 1, 1988
45.21
-0.046
-0.1%
jan 1, 1989
45.11
-0.099
-0.22%
jan 1, 1990
44.951
-0.16
-0.35%
jan 1, 1991
44.735
-0.215
-0.48%
jan 1, 1992
44.617
-0.118
-0.26%
jan 1, 1993
44.431
-0.187
-0.42%
jan 1, 1994
44.196
-0.235
-0.53%
jan 1, 1995
43.94
-0.256
-0.58%
jan 1, 1996
43.681
-0.259
-0.59%
jan 1, 1997
43.679
-0.002
0.0%
jan 1, 1998
43.665
-0.015
-0.03%
jan 1, 1999
43.63
-0.035
-0.08%
jan 1, 2000
43.561
-0.069
-0.16%
jan 1, 2001
43.453
-0.108
-0.25%
jan 1, 2002
43.659
+0.207
0.48%
jan 1, 2003
43.818
+0.158
0.36%
jan 1, 2004
43.933
+0.115
0.26%
jan 1, 2005
44.019
+0.086
0.2%
jan 1, 2006
44.084
+0.065
0.15%
jan 1, 2007
44.053
-0.031
-0.07%
jan 1, 2008
43.998
-0.055
-0.12%
jan 1, 2009
43.913
-0.085
-0.19%
jan 1, 2010
43.795
-0.118
-0.27%
jan 1, 2011
43.652
-0.143
-0.33%
jan 1, 2012
43.442
-0.21
-0.48%
jan 1, 2013
43.216
-0.226
-0.52%
jan 1, 2014
42.975
-0.241
-0.56%
jan 1, 2015
42.725
-0.25
-0.58%
jan 1, 2016
42.474
-0.251
-0.59%
Ranking of countries by current statistics by years


Comments: