29
/
en
AIzaSyAYiBZKx7MnpbEhh9jyipgxe19OcubqV5w
April 1, 2024
112761
Costa Rica
CRI
true
2
1
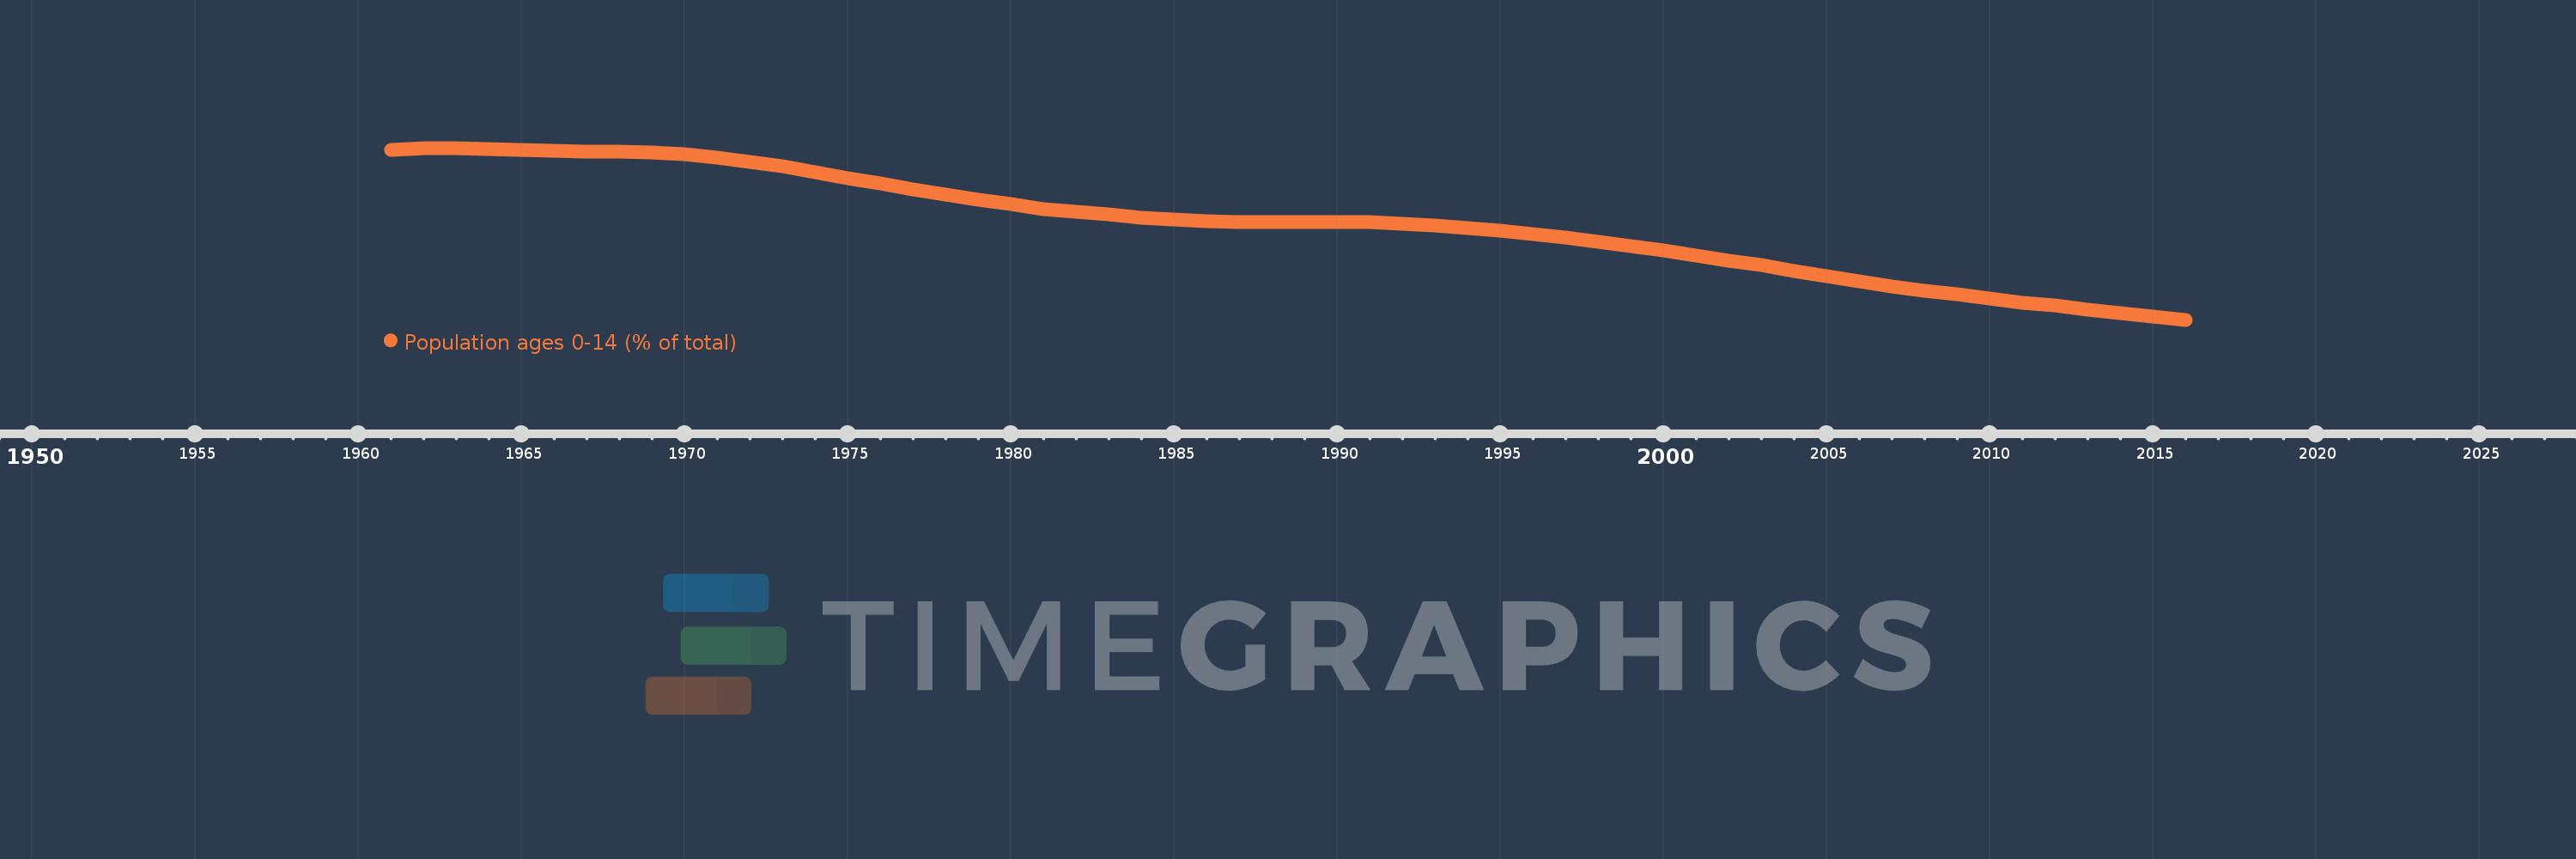
Population ages 0-14 (% of total)
2016,2015,2014,2013,2012,2011,2010,2009,2008,2007,2006,2005,2004,2003,2002,2001,2000,1999,1998,1997,1996,1995,1994,1993,1992,1991,1990,1989,1988,1987,1986,1985,1984,1983,1982,1981,1980,1979,1978,1977,1976,1975,1974,1973,1972,1971,1970,1969,1968,1967,1966,1965,1964,1963,1962,1961
This statistics in other country:
AfghanistanAlbaniaAlgeriaAngolaAntigua and BarbudaArab WorldArgentinaArmeniaArubaAustraliaAustriaAzerbaijanBahamas, TheBahrainBangladeshBarbadosBelarusBelgiumBelizeBeninBhutanBoliviaBosnia and HerzegovinaBotswanaBrazilBrunei DarussalamBulgariaBurkina FasoBurundiCabo VerdeCambodiaCameroonCanadaCaribbean small statesCentral African RepublicCentral Europe and the BalticsChadChannel IslandsChileChinaColombiaComorosCongo, Dem. Rep.Congo, Rep.Costa RicaCote d'IvoireCroatiaCubaCuracaoCyprusCzech RepublicDenmarkDjiboutiDominican RepublicEarly-demographic dividendEast Asia & PacificEast Asia & Pacific (excluding high income)East Asia & Pacific (IDA & IBRD countries)EcuadorEgypt, Arab Rep.El SalvadorEquatorial GuineaEritreaEstoniaEthiopiaEuro areaEurope & Central AsiaEurope & Central Asia (excluding high income)Europe & Central Asia (IDA & IBRD countries)European UnionFijiFinlandFragile and conflict affected situationsFranceFrench PolynesiaGabonGambia, TheGeorgiaGermanyGhanaGreeceGrenadaGuamGuatemalaGuineaGuinea-BissauGuyanaHaitiHeavily indebted poor countries (HIPC)High incomeHondurasHong Kong SAR, ChinaHungaryIBRD onlyIcelandIDA & IBRD totalIDA blendIDA onlyIDA totalIndiaIndonesiaIran, Islamic Rep.IraqIrelandIsraelItalyJamaicaJapanJordanKazakhstanKenyaKiribatiKorea, Dem. People’s Rep.Korea, Rep.KosovoKuwaitKyrgyz RepublicLao PDRLate-demographic dividendLatin America & Caribbean Latin America & Caribbean (excluding high income)Latin America & the Caribbean (IDA & IBRD countries)LatviaLeast developed countries: UN classificationLebanonLesothoLiberiaLibyaLithuaniaLow & middle incomeLow incomeLower middle incomeLuxembourgMacao SAR, ChinaMacedonia, FYRMadagascarMalawiMalaysiaMaldivesMaliMaltaMauritaniaMauritiusMexicoMicronesia, Fed. Sts.Middle East & North AfricaMiddle East & North Africa (excluding high income)Middle East & North Africa (IDA & IBRD countries)Middle incomeMoldovaMongoliaMontenegroMoroccoMozambiqueMyanmarNamibiaNepalNetherlandsNew CaledoniaNew ZealandNicaraguaNigerNigeriaNorth AmericaNorwayOECD membersOmanOther small statesPacific island small statesPakistanPanamaPapua New GuineaParaguayPeruPhilippinesPolandPortugalPost-demographic dividendPre-demographic dividendPuerto RicoQatarRomaniaRussian FederationRwandaSamoaSao Tome and PrincipeSaudi ArabiaSenegalSerbiaSeychellesSierra LeoneSingaporeSlovak RepublicSloveniaSmall statesSolomon IslandsSomaliaSouth AfricaSouth AsiaSouth Asia (IDA & IBRD)South SudanSpainSri LankaSt. LuciaSt. Vincent and the GrenadinesSub-Saharan Africa Sub-Saharan Africa (excluding high income)Sub-Saharan Africa (IDA & IBRD countries)SudanSurinameSwazilandSwedenSwitzerlandSyrian Arab RepublicTajikistanTanzaniaThailandTimor-LesteTogoTongaTrinidad and TobagoTunisiaTurkeyTurkmenistanUgandaUkraineUnited Arab EmiratesUnited KingdomUnited StatesUpper middle incomeUruguayUzbekistanVanuatuVenezuela, RBVietnamVirgin Islands (U.S.)West Bank and GazaWorldYemen, Rep.ZambiaZimbabwe Timeline:
This timeline shows a graph from 1961 to 2016 of Costa Rica. No data until 1960. Number of actual observations by date: 56.
Source name:
World Development Indicators
Source organization:
World Bank staff estimates based on age distributions of United Nations Population Division's World Population Prospects.
Categories, topics:
Education, Health
Last updated:
apr 23, 2017
Indicators value changes by year
Minimum:
22.309
jan 1, 2016
Maximum:
44.954
jan 1, 1962
At the date of observation
Value
Absolute change
Change from previous value
jan 1, 1961
44.722
+44.722
0.0%
jan 1, 1962
44.954
+0.232
0.52%
jan 1, 1963
44.942
-0.012
-0.03%
jan 1, 1964
44.793
-0.149
-0.33%
jan 1, 1965
44.644
-0.149
-0.33%
jan 1, 1966
44.539
-0.104
-0.23%
jan 1, 1967
44.497
-0.043
-0.1%
jan 1, 1968
44.431
-0.066
-0.15%
jan 1, 1969
44.313
-0.118
-0.27%
jan 1, 1970
44.076
-0.236
-0.53%
jan 1, 1971
43.685
-0.391
-0.89%
jan 1, 1972
43.165
-0.521
-1.19%
jan 1, 1973
42.523
-0.642
-1.49%
jan 1, 1974
41.785
-0.738
-1.74%
jan 1, 1975
41.009
-0.776
-1.86%
jan 1, 1976
40.245
-0.765
-1.86%
jan 1, 1977
39.448
-0.797
-1.98%
jan 1, 1978
38.75
-0.698
-1.77%
jan 1, 1979
38.12
-0.63
-1.63%
jan 1, 1980
37.513
-0.607
-1.59%
jan 1, 1981
36.922
-0.591
-1.58%
jan 1, 1982
36.572
-0.349
-0.95%
jan 1, 1983
36.168
-0.404
-1.1%
jan 1, 1984
35.778
-0.391
-1.08%
jan 1, 1985
35.481
-0.297
-0.83%
jan 1, 1986
35.302
-0.179
-0.5%
jan 1, 1987
35.209
-0.093
-0.26%
jan 1, 1988
35.194
-0.015
-0.04%
jan 1, 1989
35.218
+0.023
0.07%
jan 1, 1990
35.21
-0.008
-0.02%
jan 1, 1991
35.132
-0.078
-0.22%
jan 1, 1992
34.959
-0.173
-0.49%
jan 1, 1993
34.711
-0.248
-0.71%
jan 1, 1994
34.388
-0.323
-0.93%
jan 1, 1995
34.004
-0.384
-1.12%
jan 1, 1996
33.568
-0.436
-1.28%
jan 1, 1997
33.109
-0.459
-1.37%
jan 1, 1998
32.601
-0.509
-1.54%
jan 1, 1999
32.039
-0.562
-1.72%
jan 1, 2000
31.419
-0.619
-1.93%
jan 1, 2001
30.743
-0.676
-2.15%
jan 1, 2002
30.14
-0.604
-1.96%
jan 1, 2003
29.469
-0.671
-2.23%
jan 1, 2004
28.76
-0.709
-2.4%
jan 1, 2005
28.06
-0.7
-2.43%
jan 1, 2006
27.398
-0.663
-2.36%
jan 1, 2007
26.746
-0.652
-2.38%
jan 1, 2008
26.175
-0.571
-2.13%
jan 1, 2009
25.653
-0.522
-1.99%
jan 1, 2010
25.128
-0.525
-2.05%
jan 1, 2011
24.579
-0.549
-2.19%
jan 1, 2012
24.15
-0.429
-1.75%
jan 1, 2013
23.662
-0.488
-2.02%
jan 1, 2014
23.158
-0.504
-2.13%
jan 1, 2015
22.698
-0.46
-1.98%
jan 1, 2016
22.309
-0.39
-1.72%
Ranking of countries by current statistics by years


Comments: