29
/
en
AIzaSyAYiBZKx7MnpbEhh9jyipgxe19OcubqV5w
April 1, 2024
49411
Middle East & North Africa (excluding high income)
MNA
false
2
1
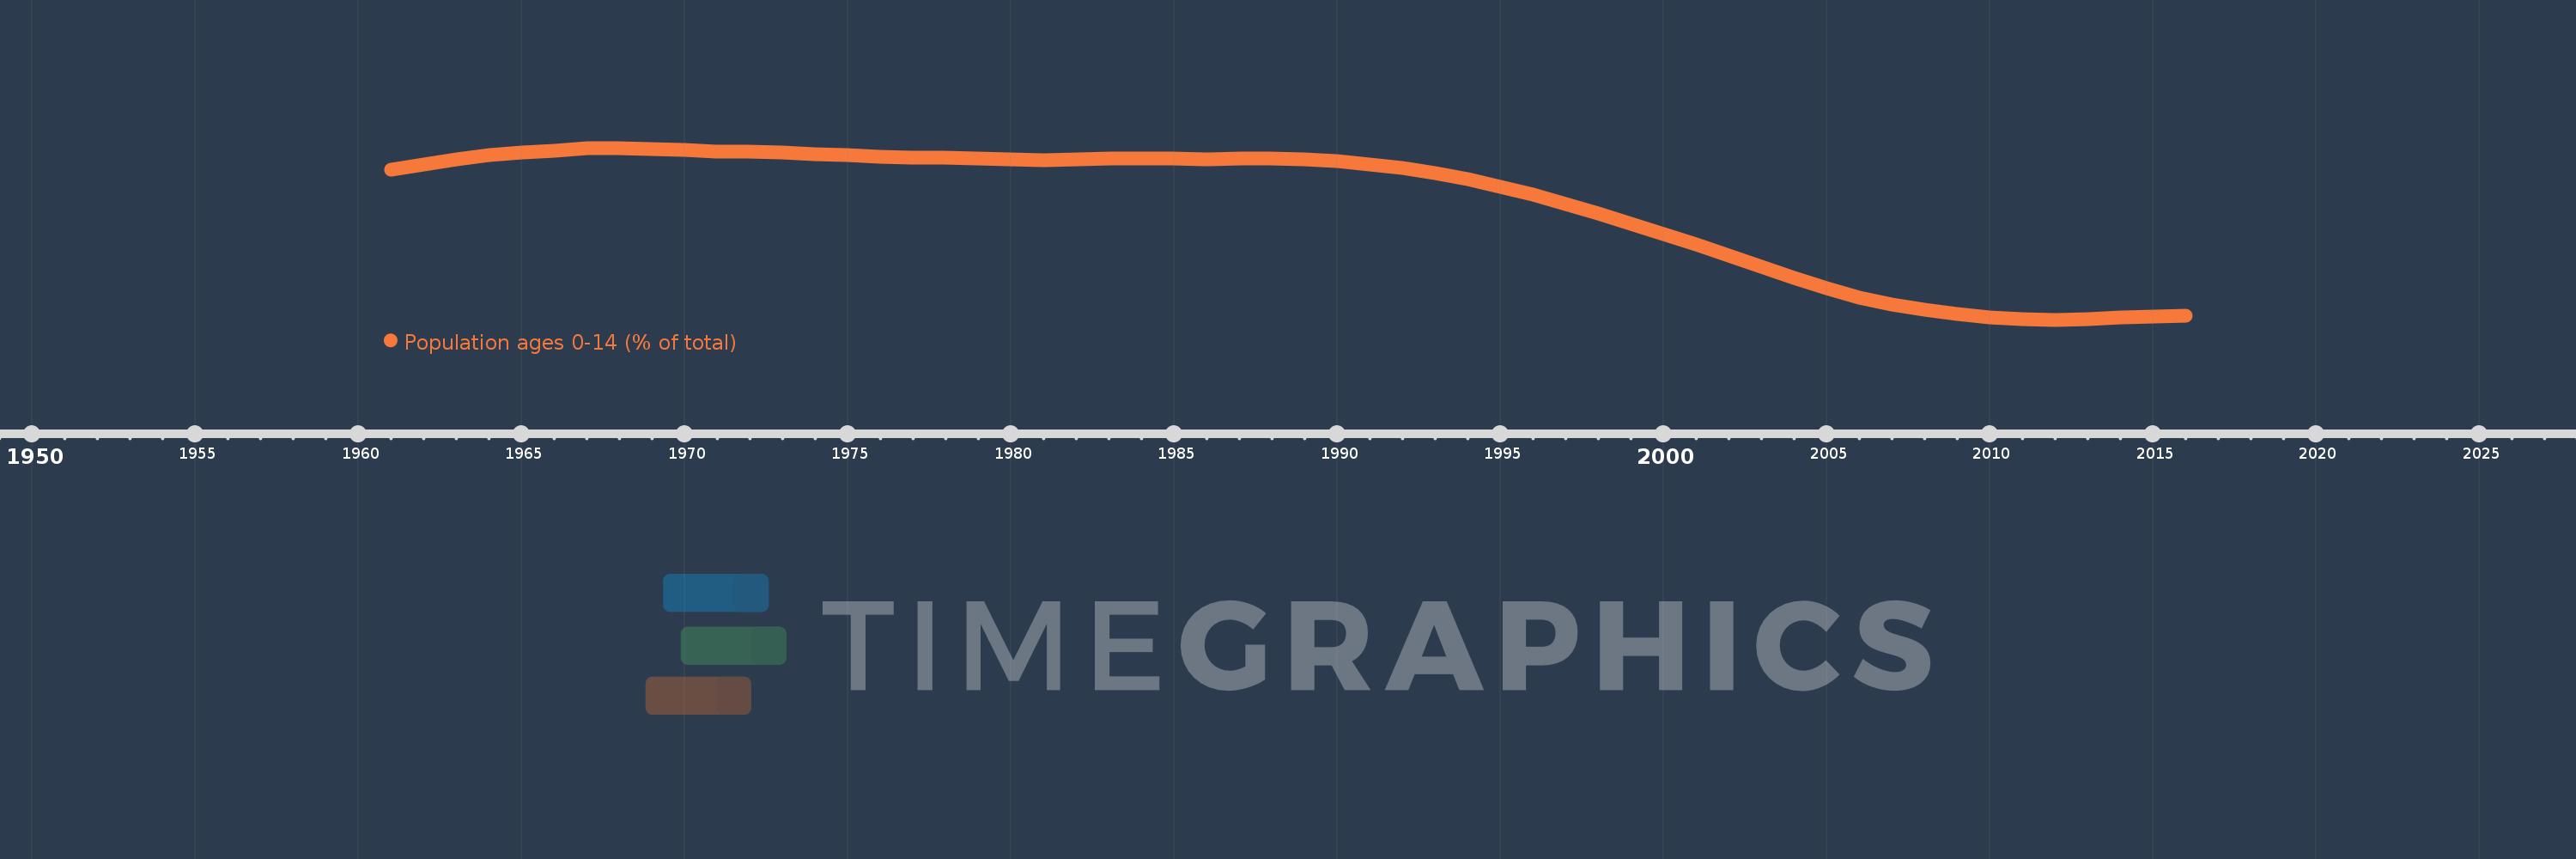
Population ages 0-14 (% of total)
2016,2015,2014,2013,2012,2011,2010,2009,2008,2007,2006,2005,2004,2003,2002,2001,2000,1999,1998,1997,1996,1995,1994,1993,1992,1991,1990,1989,1988,1987,1986,1985,1984,1983,1982,1981,1980,1979,1978,1977,1976,1975,1974,1973,1972,1971,1970,1969,1968,1967,1966,1965,1964,1963,1962,1961
This statistics in other country:
AfghanistanAlbaniaAlgeriaAngolaAntigua and BarbudaArab WorldArgentinaArmeniaArubaAustraliaAustriaAzerbaijanBahamas, TheBahrainBangladeshBarbadosBelarusBelgiumBelizeBeninBhutanBoliviaBosnia and HerzegovinaBotswanaBrazilBrunei DarussalamBulgariaBurkina FasoBurundiCabo VerdeCambodiaCameroonCanadaCaribbean small statesCentral African RepublicCentral Europe and the BalticsChadChannel IslandsChileChinaColombiaComorosCongo, Dem. Rep.Congo, Rep.Costa RicaCote d'IvoireCroatiaCubaCuracaoCyprusCzech RepublicDenmarkDjiboutiDominican RepublicEarly-demographic dividendEast Asia & PacificEast Asia & Pacific (excluding high income)East Asia & Pacific (IDA & IBRD countries)EcuadorEgypt, Arab Rep.El SalvadorEquatorial GuineaEritreaEstoniaEthiopiaEuro areaEurope & Central AsiaEurope & Central Asia (excluding high income)Europe & Central Asia (IDA & IBRD countries)European UnionFijiFinlandFragile and conflict affected situationsFranceFrench PolynesiaGabonGambia, TheGeorgiaGermanyGhanaGreeceGrenadaGuamGuatemalaGuineaGuinea-BissauGuyanaHaitiHeavily indebted poor countries (HIPC)High incomeHondurasHong Kong SAR, ChinaHungaryIBRD onlyIcelandIDA & IBRD totalIDA blendIDA onlyIDA totalIndiaIndonesiaIran, Islamic Rep.IraqIrelandIsraelItalyJamaicaJapanJordanKazakhstanKenyaKiribatiKorea, Dem. People’s Rep.Korea, Rep.KosovoKuwaitKyrgyz RepublicLao PDRLate-demographic dividendLatin America & Caribbean Latin America & Caribbean (excluding high income)Latin America & the Caribbean (IDA & IBRD countries)LatviaLeast developed countries: UN classificationLebanonLesothoLiberiaLibyaLithuaniaLow & middle incomeLow incomeLower middle incomeLuxembourgMacao SAR, ChinaMacedonia, FYRMadagascarMalawiMalaysiaMaldivesMaliMaltaMauritaniaMauritiusMexicoMicronesia, Fed. Sts.Middle East & North AfricaMiddle East & North Africa (excluding high income)Middle East & North Africa (IDA & IBRD countries)Middle incomeMoldovaMongoliaMontenegroMoroccoMozambiqueMyanmarNamibiaNepalNetherlandsNew CaledoniaNew ZealandNicaraguaNigerNigeriaNorth AmericaNorwayOECD membersOmanOther small statesPacific island small statesPakistanPanamaPapua New GuineaParaguayPeruPhilippinesPolandPortugalPost-demographic dividendPre-demographic dividendPuerto RicoQatarRomaniaRussian FederationRwandaSamoaSao Tome and PrincipeSaudi ArabiaSenegalSerbiaSeychellesSierra LeoneSingaporeSlovak RepublicSloveniaSmall statesSolomon IslandsSomaliaSouth AfricaSouth AsiaSouth Asia (IDA & IBRD)South SudanSpainSri LankaSt. LuciaSt. Vincent and the GrenadinesSub-Saharan Africa Sub-Saharan Africa (excluding high income)Sub-Saharan Africa (IDA & IBRD countries)SudanSurinameSwazilandSwedenSwitzerlandSyrian Arab RepublicTajikistanTanzaniaThailandTimor-LesteTogoTongaTrinidad and TobagoTunisiaTurkeyTurkmenistanUgandaUkraineUnited Arab EmiratesUnited KingdomUnited StatesUpper middle incomeUruguayUzbekistanVanuatuVenezuela, RBVietnamVirgin Islands (U.S.)West Bank and GazaWorldYemen, Rep.ZambiaZimbabwe Timeline:
This timeline shows a graph from 1961 to 2016 of Middle East & North Africa (excluding high income). No data until 1960. Number of actual observations by date: 56.
Source name:
World Development Indicators
Source organization:
World Bank staff estimates based on age distributions of United Nations Population Division's World Population Prospects.
Categories, topics:
Education, Health
Last updated:
apr 23, 2017
Indicators value changes by year
Minimum:
30.813
jan 1, 2012
Maximum:
44.733
jan 1, 1968
At the date of observation
Value
Absolute change
Change from previous value
jan 1, 1961
42.975
+42.975
0.0%
jan 1, 1962
43.401
+0.427
0.99%
jan 1, 1963
43.803
+0.402
0.93%
jan 1, 1964
44.147
+0.344
0.78%
jan 1, 1965
44.384
+0.237
0.54%
jan 1, 1966
44.496
+0.112
0.25%
jan 1, 1967
44.689
+0.194
0.44%
jan 1, 1968
44.733
+0.044
0.1%
jan 1, 1969
44.673
-0.06
-0.13%
jan 1, 1970
44.564
-0.109
-0.24%
jan 1, 1971
44.431
-0.133
-0.3%
jan 1, 1972
44.419
-0.012
-0.03%
jan 1, 1973
44.354
-0.065
-0.15%
jan 1, 1974
44.254
-0.1
-0.23%
jan 1, 1975
44.138
-0.116
-0.26%
jan 1, 1976
44.02
-0.118
-0.27%
jan 1, 1977
43.962
-0.058
-0.13%
jan 1, 1978
43.915
-0.048
-0.11%
jan 1, 1979
43.869
-0.046
-0.1%
jan 1, 1980
43.818
-0.051
-0.12%
jan 1, 1981
43.765
-0.053
-0.12%
jan 1, 1982
43.826
+0.061
0.14%
jan 1, 1983
43.855
+0.029
0.07%
jan 1, 1984
43.862
+0.007
0.02%
jan 1, 1985
43.856
-0.006
-0.01%
jan 1, 1986
43.83
-0.026
-0.06%
jan 1, 1987
43.883
+0.052
0.12%
jan 1, 1988
43.879
-0.004
-0.01%
jan 1, 1989
43.806
-0.073
-0.17%
jan 1, 1990
43.646
-0.16
-0.37%
jan 1, 1991
43.424
-0.222
-0.51%
jan 1, 1992
43.104
-0.32
-0.74%
jan 1, 1993
42.689
-0.415
-0.96%
jan 1, 1994
42.187
-0.502
-1.18%
jan 1, 1995
41.606
-0.58
-1.38%
jan 1, 1996
40.964
-0.642
-1.54%
jan 1, 1997
40.214
-0.75
-1.83%
jan 1, 1998
39.434
-0.78
-1.94%
jan 1, 1999
38.622
-0.812
-2.06%
jan 1, 2000
37.775
-0.847
-2.19%
jan 1, 2001
36.898
-0.877
-2.32%
jan 1, 2002
36.014
-0.884
-2.4%
jan 1, 2003
35.11
-0.903
-2.51%
jan 1, 2004
34.208
-0.903
-2.57%
jan 1, 2005
33.349
-0.859
-2.51%
jan 1, 2006
32.576
-0.773
-2.32%
jan 1, 2007
32.051
-0.525
-1.61%
jan 1, 2008
31.609
-0.442
-1.38%
jan 1, 2009
31.259
-0.35
-1.11%
jan 1, 2010
31.002
-0.257
-0.82%
jan 1, 2011
30.83
-0.172
-0.56%
jan 1, 2012
30.813
-0.017
-0.05%
jan 1, 2013
30.869
+0.056
0.18%
jan 1, 2014
30.971
+0.102
0.33%
jan 1, 2015
31.075
+0.104
0.34%
jan 1, 2016
31.15
+0.075
0.24%
Ranking of countries by current statistics by years


Comments: