29
/
en
AIzaSyAYiBZKx7MnpbEhh9jyipgxe19OcubqV5w
April 1, 2024
175745
Latvia
LVA
true
2
1
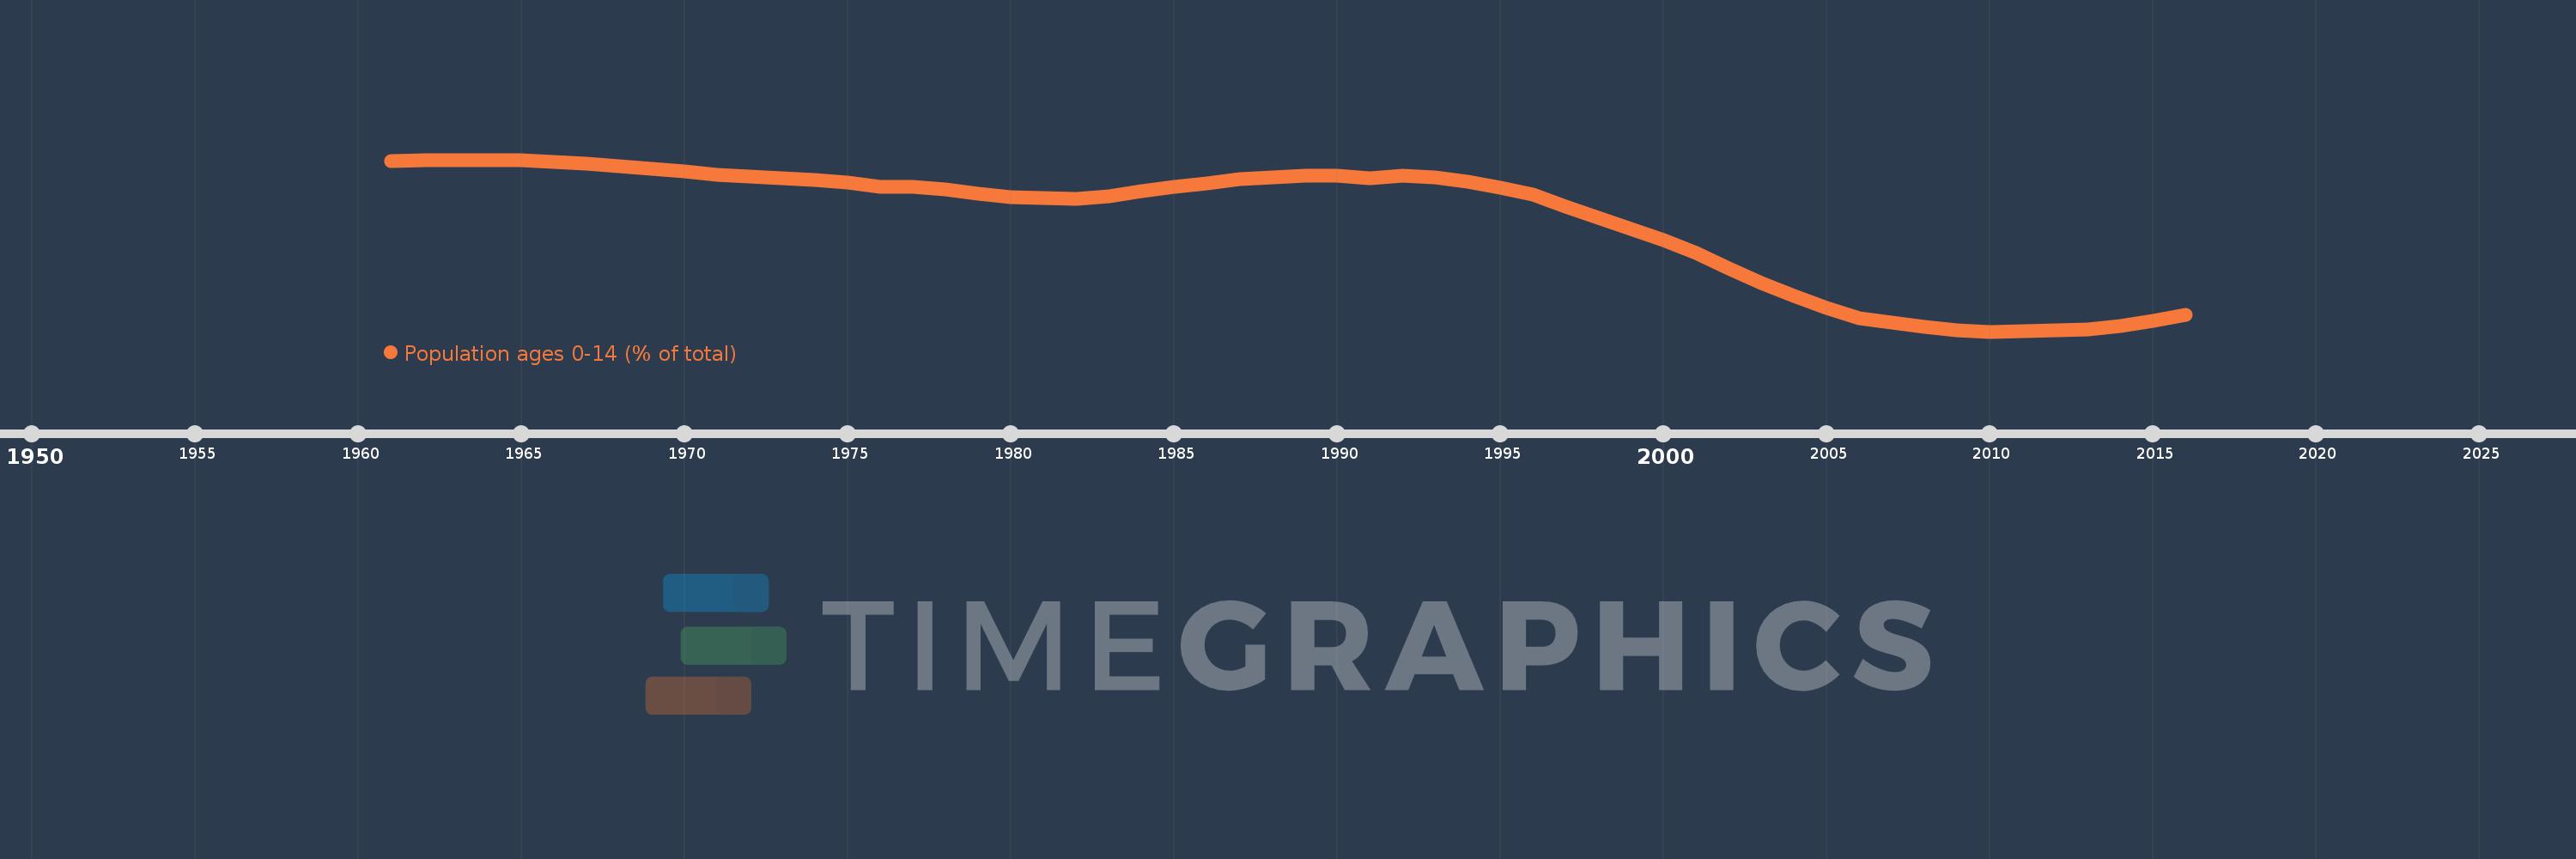
Population ages 0-14 (% of total)
2016,2015,2014,2013,2012,2011,2010,2009,2008,2007,2006,2005,2004,2003,2002,2001,2000,1999,1998,1997,1996,1995,1994,1993,1992,1991,1990,1989,1988,1987,1986,1985,1984,1983,1982,1981,1980,1979,1978,1977,1976,1975,1974,1973,1972,1971,1970,1969,1968,1967,1966,1965,1964,1963,1962,1961
This statistics in other country:
AfghanistanAlbaniaAlgeriaAngolaAntigua and BarbudaArab WorldArgentinaArmeniaArubaAustraliaAustriaAzerbaijanBahamas, TheBahrainBangladeshBarbadosBelarusBelgiumBelizeBeninBhutanBoliviaBosnia and HerzegovinaBotswanaBrazilBrunei DarussalamBulgariaBurkina FasoBurundiCabo VerdeCambodiaCameroonCanadaCaribbean small statesCentral African RepublicCentral Europe and the BalticsChadChannel IslandsChileChinaColombiaComorosCongo, Dem. Rep.Congo, Rep.Costa RicaCote d'IvoireCroatiaCubaCuracaoCyprusCzech RepublicDenmarkDjiboutiDominican RepublicEarly-demographic dividendEast Asia & PacificEast Asia & Pacific (excluding high income)East Asia & Pacific (IDA & IBRD countries)EcuadorEgypt, Arab Rep.El SalvadorEquatorial GuineaEritreaEstoniaEthiopiaEuro areaEurope & Central AsiaEurope & Central Asia (excluding high income)Europe & Central Asia (IDA & IBRD countries)European UnionFijiFinlandFragile and conflict affected situationsFranceFrench PolynesiaGabonGambia, TheGeorgiaGermanyGhanaGreeceGrenadaGuamGuatemalaGuineaGuinea-BissauGuyanaHaitiHeavily indebted poor countries (HIPC)High incomeHondurasHong Kong SAR, ChinaHungaryIBRD onlyIcelandIDA & IBRD totalIDA blendIDA onlyIDA totalIndiaIndonesiaIran, Islamic Rep.IraqIrelandIsraelItalyJamaicaJapanJordanKazakhstanKenyaKiribatiKorea, Dem. People’s Rep.Korea, Rep.KosovoKuwaitKyrgyz RepublicLao PDRLate-demographic dividendLatin America & Caribbean Latin America & Caribbean (excluding high income)Latin America & the Caribbean (IDA & IBRD countries)LatviaLeast developed countries: UN classificationLebanonLesothoLiberiaLibyaLithuaniaLow & middle incomeLow incomeLower middle incomeLuxembourgMacao SAR, ChinaMacedonia, FYRMadagascarMalawiMalaysiaMaldivesMaliMaltaMauritaniaMauritiusMexicoMicronesia, Fed. Sts.Middle East & North AfricaMiddle East & North Africa (excluding high income)Middle East & North Africa (IDA & IBRD countries)Middle incomeMoldovaMongoliaMontenegroMoroccoMozambiqueMyanmarNamibiaNepalNetherlandsNew CaledoniaNew ZealandNicaraguaNigerNigeriaNorth AmericaNorwayOECD membersOmanOther small statesPacific island small statesPakistanPanamaPapua New GuineaParaguayPeruPhilippinesPolandPortugalPost-demographic dividendPre-demographic dividendPuerto RicoQatarRomaniaRussian FederationRwandaSamoaSao Tome and PrincipeSaudi ArabiaSenegalSerbiaSeychellesSierra LeoneSingaporeSlovak RepublicSloveniaSmall statesSolomon IslandsSomaliaSouth AfricaSouth AsiaSouth Asia (IDA & IBRD)South SudanSpainSri LankaSt. LuciaSt. Vincent and the GrenadinesSub-Saharan Africa Sub-Saharan Africa (excluding high income)Sub-Saharan Africa (IDA & IBRD countries)SudanSurinameSwazilandSwedenSwitzerlandSyrian Arab RepublicTajikistanTanzaniaThailandTimor-LesteTogoTongaTrinidad and TobagoTunisiaTurkeyTurkmenistanUgandaUkraineUnited Arab EmiratesUnited KingdomUnited StatesUpper middle incomeUruguayUzbekistanVanuatuVenezuela, RBVietnamVirgin Islands (U.S.)West Bank and GazaWorldYemen, Rep.ZambiaZimbabwe Timeline:
This timeline shows a graph from 1961 to 2016 of Latvia. No data until 1960. Number of actual observations by date: 56.
Source name:
World Development Indicators
Source organization:
World Bank staff estimates based on age distributions of United Nations Population Division's World Population Prospects.
Categories, topics:
Education, Health
Last updated:
apr 23, 2017
Indicators value changes by year
Minimum:
14.119
jan 1, 2010
Maximum:
22.305
jan 1, 1963
At the date of observation
Value
Absolute change
Change from previous value
jan 1, 1961
22.234
+22.234
0.0%
jan 1, 1962
22.285
+0.051
0.23%
jan 1, 1963
22.305
+0.02
0.09%
jan 1, 1964
22.299
-0.007
-0.03%
jan 1, 1965
22.268
-0.03
-0.14%
jan 1, 1966
22.214
-0.055
-0.25%
jan 1, 1967
22.121
-0.093
-0.42%
jan 1, 1968
22.008
-0.113
-0.51%
jan 1, 1969
21.876
-0.132
-0.6%
jan 1, 1970
21.738
-0.138
-0.63%
jan 1, 1971
21.609
-0.129
-0.59%
jan 1, 1972
21.495
-0.114
-0.53%
jan 1, 1973
21.415
-0.08
-0.37%
jan 1, 1974
21.334
-0.081
-0.38%
jan 1, 1975
21.202
-0.132
-0.62%
jan 1, 1976
21.003
-0.198
-0.94%
jan 1, 1977
21.01
+0.007
0.03%
jan 1, 1978
20.885
-0.125
-0.6%
jan 1, 1979
20.694
-0.191
-0.91%
jan 1, 1980
20.545
-0.149
-0.72%
jan 1, 1981
20.498
-0.047
-0.23%
jan 1, 1982
20.456
-0.042
-0.2%
jan 1, 1983
20.582
+0.125
0.61%
jan 1, 1984
20.807
+0.225
1.09%
jan 1, 1985
21.024
+0.217
1.04%
jan 1, 1986
21.183
+0.159
0.76%
jan 1, 1987
21.365
+0.182
0.86%
jan 1, 1988
21.486
+0.121
0.56%
jan 1, 1989
21.547
+0.062
0.29%
jan 1, 1990
21.541
-0.006
-0.03%
jan 1, 1991
21.435
-0.106
-0.49%
jan 1, 1992
21.543
+0.109
0.51%
jan 1, 1993
21.481
-0.062
-0.29%
jan 1, 1994
21.273
-0.208
-0.97%
jan 1, 1995
20.982
-0.291
-1.37%
jan 1, 1996
20.656
-0.325
-1.55%
jan 1, 1997
20.087
-0.569
-2.75%
jan 1, 1998
19.545
-0.542
-2.7%
jan 1, 1999
19.019
-0.526
-2.69%
jan 1, 2000
18.462
-0.557
-2.93%
jan 1, 2001
17.851
-0.61
-3.31%
jan 1, 2002
17.125
-0.726
-4.07%
jan 1, 2003
16.447
-0.678
-3.96%
jan 1, 2004
15.814
-0.633
-3.85%
jan 1, 2005
15.247
-0.567
-3.58%
jan 1, 2006
14.769
-0.479
-3.14%
jan 1, 2007
14.55
-0.219
-1.48%
jan 1, 2008
14.34
-0.21
-1.44%
jan 1, 2009
14.183
-0.157
-1.1%
jan 1, 2010
14.119
-0.064
-0.45%
jan 1, 2011
14.155
+0.036
0.25%
jan 1, 2012
14.162
+0.007
0.05%
jan 1, 2013
14.233
+0.071
0.5%
jan 1, 2014
14.391
+0.158
1.11%
jan 1, 2015
14.629
+0.238
1.66%
jan 1, 2016
14.922
+0.293
2.01%
Ranking of countries by current statistics by years


Comments: