29
/
en
AIzaSyAYiBZKx7MnpbEhh9jyipgxe19OcubqV5w
April 1, 2024
208322
Netherlands
NLD
true
2
1
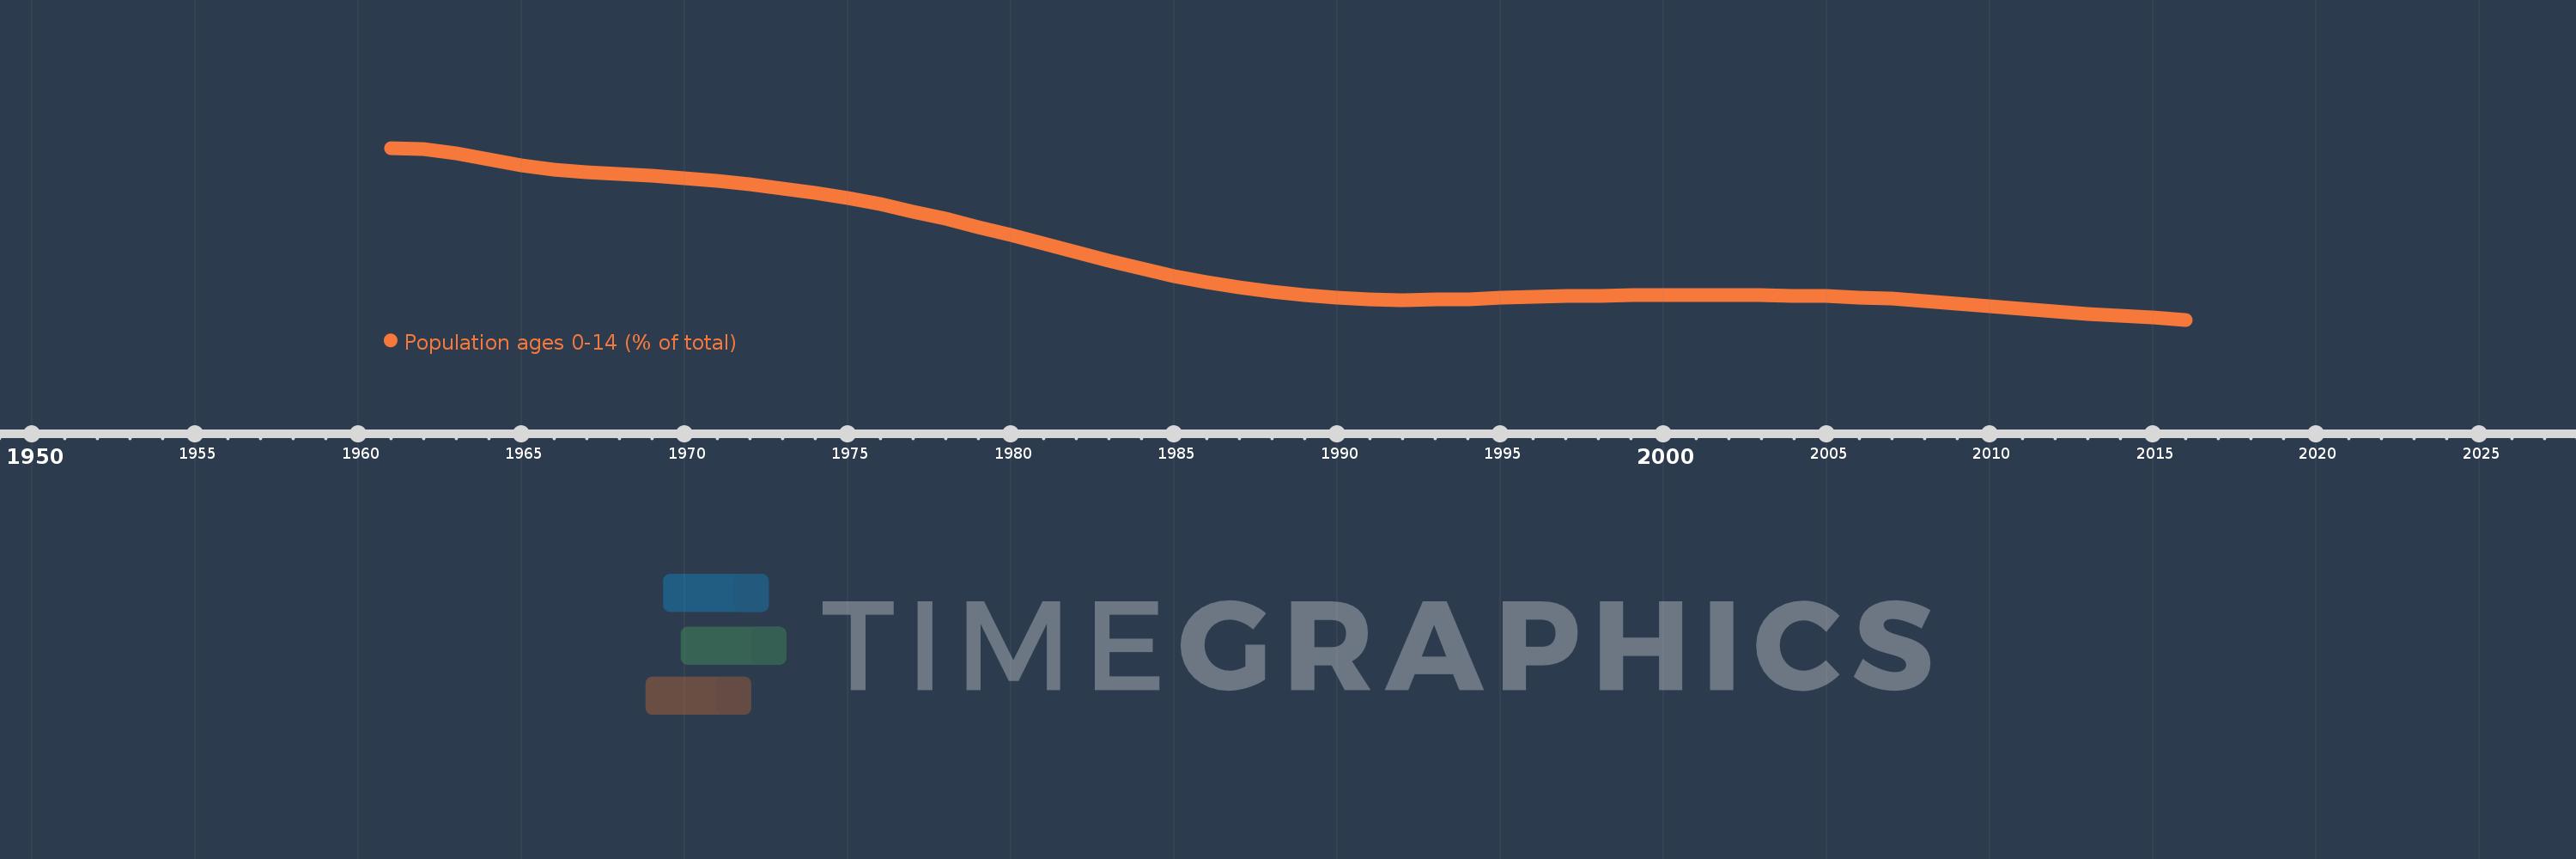
Population ages 0-14 (% of total)
2016,2015,2014,2013,2012,2011,2010,2009,2008,2007,2006,2005,2004,2003,2002,2001,2000,1999,1998,1997,1996,1995,1994,1993,1992,1991,1990,1989,1988,1987,1986,1985,1984,1983,1982,1981,1980,1979,1978,1977,1976,1975,1974,1973,1972,1971,1970,1969,1968,1967,1966,1965,1964,1963,1962,1961
This statistics in other country:
AfghanistanAlbaniaAlgeriaAngolaAntigua and BarbudaArab WorldArgentinaArmeniaArubaAustraliaAustriaAzerbaijanBahamas, TheBahrainBangladeshBarbadosBelarusBelgiumBelizeBeninBhutanBoliviaBosnia and HerzegovinaBotswanaBrazilBrunei DarussalamBulgariaBurkina FasoBurundiCabo VerdeCambodiaCameroonCanadaCaribbean small statesCentral African RepublicCentral Europe and the BalticsChadChannel IslandsChileChinaColombiaComorosCongo, Dem. Rep.Congo, Rep.Costa RicaCote d'IvoireCroatiaCubaCuracaoCyprusCzech RepublicDenmarkDjiboutiDominican RepublicEarly-demographic dividendEast Asia & PacificEast Asia & Pacific (excluding high income)East Asia & Pacific (IDA & IBRD countries)EcuadorEgypt, Arab Rep.El SalvadorEquatorial GuineaEritreaEstoniaEthiopiaEuro areaEurope & Central AsiaEurope & Central Asia (excluding high income)Europe & Central Asia (IDA & IBRD countries)European UnionFijiFinlandFragile and conflict affected situationsFranceFrench PolynesiaGabonGambia, TheGeorgiaGermanyGhanaGreeceGrenadaGuamGuatemalaGuineaGuinea-BissauGuyanaHaitiHeavily indebted poor countries (HIPC)High incomeHondurasHong Kong SAR, ChinaHungaryIBRD onlyIcelandIDA & IBRD totalIDA blendIDA onlyIDA totalIndiaIndonesiaIran, Islamic Rep.IraqIrelandIsraelItalyJamaicaJapanJordanKazakhstanKenyaKiribatiKorea, Dem. People’s Rep.Korea, Rep.KosovoKuwaitKyrgyz RepublicLao PDRLate-demographic dividendLatin America & Caribbean Latin America & Caribbean (excluding high income)Latin America & the Caribbean (IDA & IBRD countries)LatviaLeast developed countries: UN classificationLebanonLesothoLiberiaLibyaLithuaniaLow & middle incomeLow incomeLower middle incomeLuxembourgMacao SAR, ChinaMacedonia, FYRMadagascarMalawiMalaysiaMaldivesMaliMaltaMauritaniaMauritiusMexicoMicronesia, Fed. Sts.Middle East & North AfricaMiddle East & North Africa (excluding high income)Middle East & North Africa (IDA & IBRD countries)Middle incomeMoldovaMongoliaMontenegroMoroccoMozambiqueMyanmarNamibiaNepalNetherlandsNew CaledoniaNew ZealandNicaraguaNigerNigeriaNorth AmericaNorwayOECD membersOmanOther small statesPacific island small statesPakistanPanamaPapua New GuineaParaguayPeruPhilippinesPolandPortugalPost-demographic dividendPre-demographic dividendPuerto RicoQatarRomaniaRussian FederationRwandaSamoaSao Tome and PrincipeSaudi ArabiaSenegalSerbiaSeychellesSierra LeoneSingaporeSlovak RepublicSloveniaSmall statesSolomon IslandsSomaliaSouth AfricaSouth AsiaSouth Asia (IDA & IBRD)South SudanSpainSri LankaSt. LuciaSt. Vincent and the GrenadinesSub-Saharan Africa Sub-Saharan Africa (excluding high income)Sub-Saharan Africa (IDA & IBRD countries)SudanSurinameSwazilandSwedenSwitzerlandSyrian Arab RepublicTajikistanTanzaniaThailandTimor-LesteTogoTongaTrinidad and TobagoTunisiaTurkeyTurkmenistanUgandaUkraineUnited Arab EmiratesUnited KingdomUnited StatesUpper middle incomeUruguayUzbekistanVanuatuVenezuela, RBVietnamVirgin Islands (U.S.)West Bank and GazaWorldYemen, Rep.ZambiaZimbabwe Timeline:
This timeline shows a graph from 1961 to 2016 of Netherlands. No data until 1960. Number of actual observations by date: 56.
Source name:
World Development Indicators
Source organization:
World Bank staff estimates based on age distributions of United Nations Population Division's World Population Prospects.
Categories, topics:
Education, Health
Last updated:
apr 23, 2017
Indicators value changes by year
Minimum:
16.523
jan 1, 2016
Maximum:
30.056
jan 1, 1961
At the date of observation
Value
Absolute change
Change from previous value
jan 1, 1961
30.056
+30.056
0.0%
jan 1, 1962
29.957
-0.099
-0.33%
jan 1, 1963
29.624
-0.333
-1.11%
jan 1, 1964
29.153
-0.471
-1.59%
jan 1, 1965
28.71
-0.443
-1.52%
jan 1, 1966
28.375
-0.335
-1.17%
jan 1, 1967
28.157
-0.218
-0.77%
jan 1, 1968
27.984
-0.173
-0.61%
jan 1, 1969
27.841
-0.144
-0.51%
jan 1, 1970
27.669
-0.171
-0.62%
jan 1, 1971
27.437
-0.233
-0.84%
jan 1, 1972
27.187
-0.249
-0.91%
jan 1, 1973
26.875
-0.312
-1.15%
jan 1, 1974
26.508
-0.367
-1.37%
jan 1, 1975
26.097
-0.41
-1.55%
jan 1, 1976
25.644
-0.453
-1.74%
jan 1, 1977
25.053
-0.591
-2.31%
jan 1, 1978
24.456
-0.597
-2.38%
jan 1, 1979
23.835
-0.62
-2.54%
jan 1, 1980
23.183
-0.652
-2.73%
jan 1, 1981
22.511
-0.673
-2.9%
jan 1, 1982
21.839
-0.672
-2.98%
jan 1, 1983
21.186
-0.653
-2.99%
jan 1, 1984
20.562
-0.624
-2.95%
jan 1, 1985
19.984
-0.578
-2.81%
jan 1, 1986
19.466
-0.518
-2.59%
jan 1, 1987
19.104
-0.362
-1.86%
jan 1, 1988
18.768
-0.336
-1.76%
jan 1, 1989
18.483
-0.285
-1.52%
jan 1, 1990
18.271
-0.211
-1.14%
jan 1, 1991
18.139
-0.133
-0.73%
jan 1, 1992
18.089
-0.05
-0.28%
jan 1, 1993
18.099
+0.011
0.06%
jan 1, 1994
18.159
+0.059
0.33%
jan 1, 1995
18.236
+0.077
0.42%
jan 1, 1996
18.306
+0.07
0.38%
jan 1, 1997
18.367
+0.061
0.33%
jan 1, 1998
18.412
+0.045
0.25%
jan 1, 1999
18.439
+0.027
0.15%
jan 1, 2000
18.456
+0.017
0.09%
jan 1, 2001
18.47
+0.014
0.08%
jan 1, 2002
18.444
-0.026
-0.14%
jan 1, 2003
18.432
-0.012
-0.07%
jan 1, 2004
18.418
-0.014
-0.08%
jan 1, 2005
18.374
-0.044
-0.24%
jan 1, 2006
18.283
-0.091
-0.5%
jan 1, 2007
18.181
-0.102
-0.56%
jan 1, 2008
18.007
-0.174
-0.96%
jan 1, 2009
17.788
-0.219
-1.22%
jan 1, 2010
17.568
-0.22
-1.24%
jan 1, 2011
17.371
-0.197
-1.12%
jan 1, 2012
17.162
-0.209
-1.2%
jan 1, 2013
16.996
-0.167
-0.97%
jan 1, 2014
16.852
-0.144
-0.84%
jan 1, 2015
16.699
-0.153
-0.91%
jan 1, 2016
16.523
-0.176
-1.05%
Ranking of countries by current statistics by years


Comments: