29
/
en
AIzaSyAYiBZKx7MnpbEhh9jyipgxe19OcubqV5w
April 1, 2024
267280
Trinidad and Tobago
TTO
true
2
1
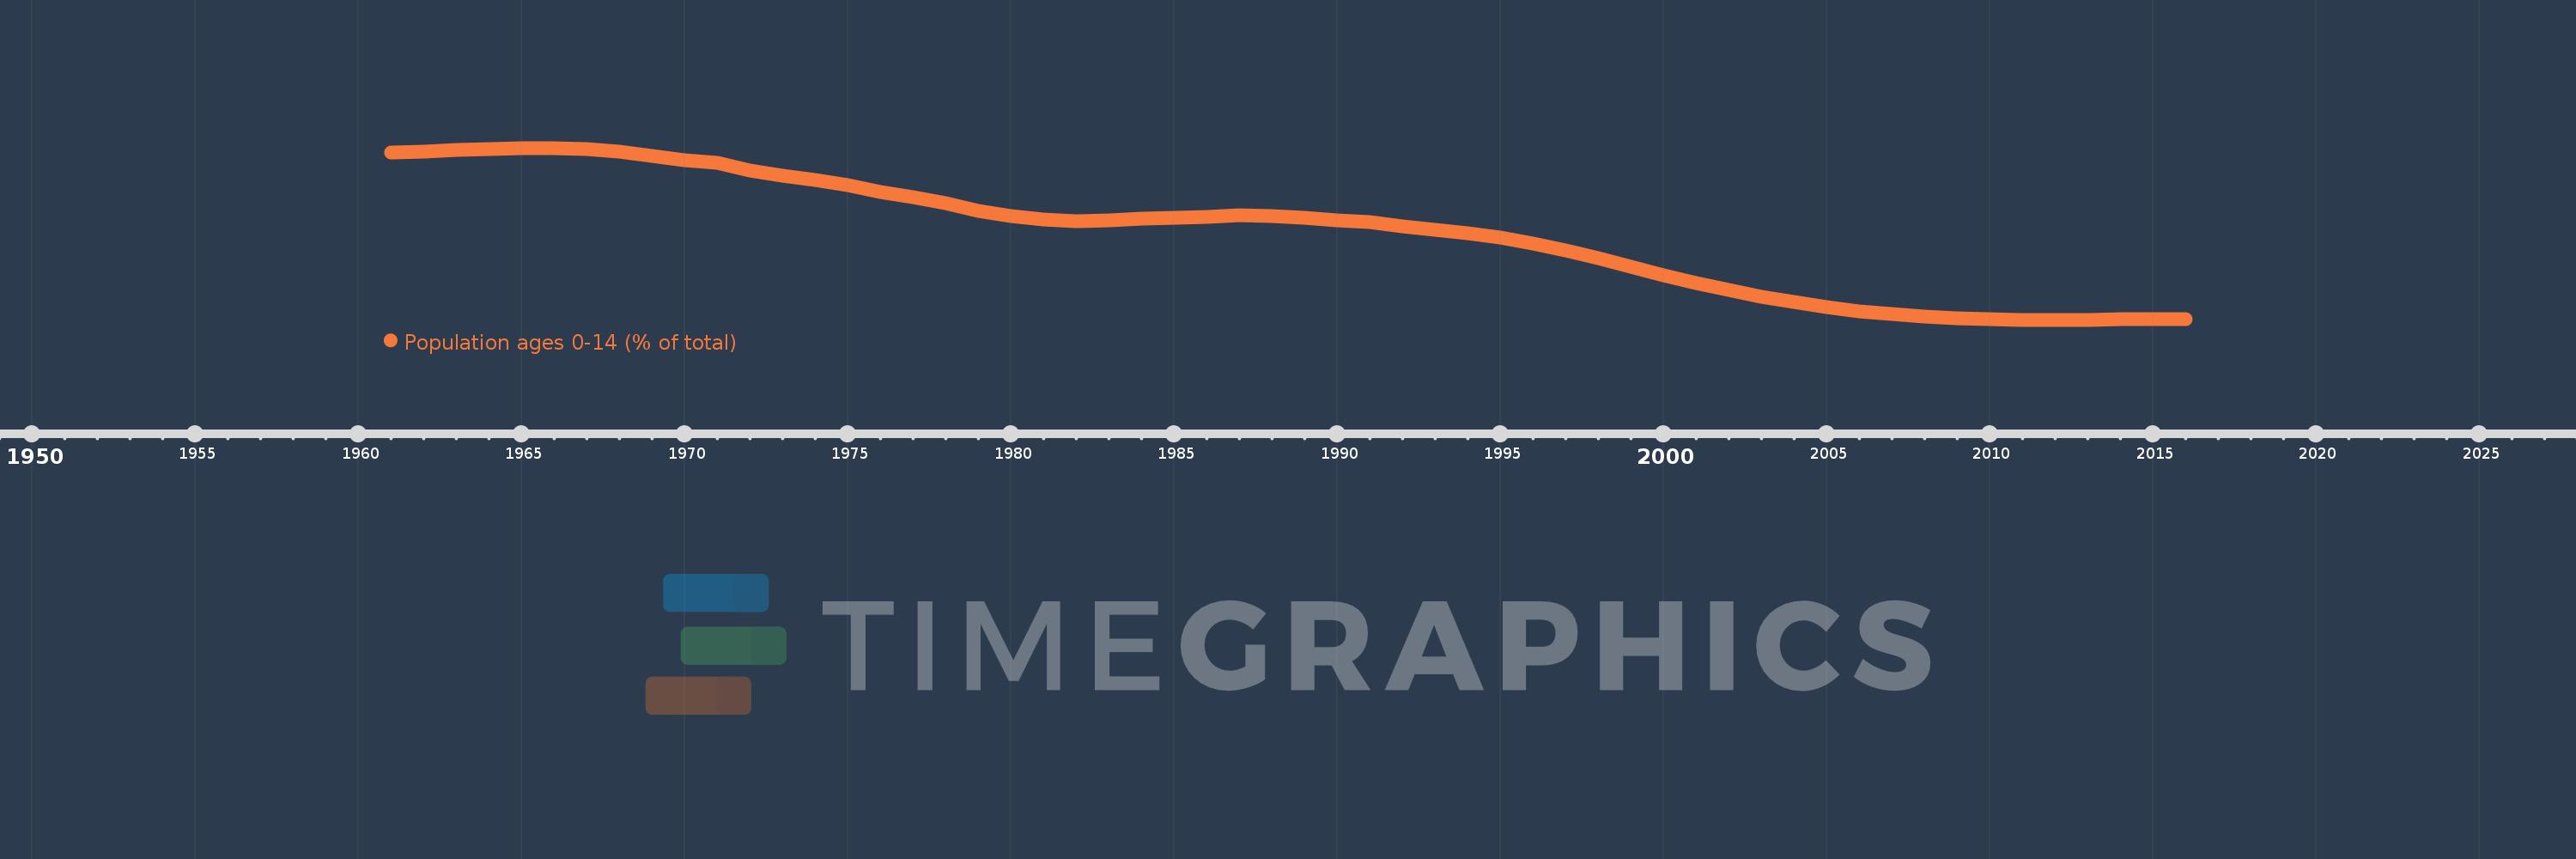
Population ages 0-14 (% of total)
2016,2015,2014,2013,2012,2011,2010,2009,2008,2007,2006,2005,2004,2003,2002,2001,2000,1999,1998,1997,1996,1995,1994,1993,1992,1991,1990,1989,1988,1987,1986,1985,1984,1983,1982,1981,1980,1979,1978,1977,1976,1975,1974,1973,1972,1971,1970,1969,1968,1967,1966,1965,1964,1963,1962,1961
This statistics in other country:
AfghanistanAlbaniaAlgeriaAngolaAntigua and BarbudaArab WorldArgentinaArmeniaArubaAustraliaAustriaAzerbaijanBahamas, TheBahrainBangladeshBarbadosBelarusBelgiumBelizeBeninBhutanBoliviaBosnia and HerzegovinaBotswanaBrazilBrunei DarussalamBulgariaBurkina FasoBurundiCabo VerdeCambodiaCameroonCanadaCaribbean small statesCentral African RepublicCentral Europe and the BalticsChadChannel IslandsChileChinaColombiaComorosCongo, Dem. Rep.Congo, Rep.Costa RicaCote d'IvoireCroatiaCubaCuracaoCyprusCzech RepublicDenmarkDjiboutiDominican RepublicEarly-demographic dividendEast Asia & PacificEast Asia & Pacific (excluding high income)East Asia & Pacific (IDA & IBRD countries)EcuadorEgypt, Arab Rep.El SalvadorEquatorial GuineaEritreaEstoniaEthiopiaEuro areaEurope & Central AsiaEurope & Central Asia (excluding high income)Europe & Central Asia (IDA & IBRD countries)European UnionFijiFinlandFragile and conflict affected situationsFranceFrench PolynesiaGabonGambia, TheGeorgiaGermanyGhanaGreeceGrenadaGuamGuatemalaGuineaGuinea-BissauGuyanaHaitiHeavily indebted poor countries (HIPC)High incomeHondurasHong Kong SAR, ChinaHungaryIBRD onlyIcelandIDA & IBRD totalIDA blendIDA onlyIDA totalIndiaIndonesiaIran, Islamic Rep.IraqIrelandIsraelItalyJamaicaJapanJordanKazakhstanKenyaKiribatiKorea, Dem. People’s Rep.Korea, Rep.KosovoKuwaitKyrgyz RepublicLao PDRLate-demographic dividendLatin America & Caribbean Latin America & Caribbean (excluding high income)Latin America & the Caribbean (IDA & IBRD countries)LatviaLeast developed countries: UN classificationLebanonLesothoLiberiaLibyaLithuaniaLow & middle incomeLow incomeLower middle incomeLuxembourgMacao SAR, ChinaMacedonia, FYRMadagascarMalawiMalaysiaMaldivesMaliMaltaMauritaniaMauritiusMexicoMicronesia, Fed. Sts.Middle East & North AfricaMiddle East & North Africa (excluding high income)Middle East & North Africa (IDA & IBRD countries)Middle incomeMoldovaMongoliaMontenegroMoroccoMozambiqueMyanmarNamibiaNepalNetherlandsNew CaledoniaNew ZealandNicaraguaNigerNigeriaNorth AmericaNorwayOECD membersOmanOther small statesPacific island small statesPakistanPanamaPapua New GuineaParaguayPeruPhilippinesPolandPortugalPost-demographic dividendPre-demographic dividendPuerto RicoQatarRomaniaRussian FederationRwandaSamoaSao Tome and PrincipeSaudi ArabiaSenegalSerbiaSeychellesSierra LeoneSingaporeSlovak RepublicSloveniaSmall statesSolomon IslandsSomaliaSouth AfricaSouth AsiaSouth Asia (IDA & IBRD)South SudanSpainSri LankaSt. LuciaSt. Vincent and the GrenadinesSub-Saharan Africa Sub-Saharan Africa (excluding high income)Sub-Saharan Africa (IDA & IBRD countries)SudanSurinameSwazilandSwedenSwitzerlandSyrian Arab RepublicTajikistanTanzaniaThailandTimor-LesteTogoTongaTrinidad and TobagoTunisiaTurkeyTurkmenistanUgandaUkraineUnited Arab EmiratesUnited KingdomUnited StatesUpper middle incomeUruguayUzbekistanVanuatuVenezuela, RBVietnamVirgin Islands (U.S.)West Bank and GazaWorldYemen, Rep.ZambiaZimbabwe Timeline:
This timeline shows a graph from 1961 to 2016 of Trinidad and Tobago. No data until 1960. Number of actual observations by date: 56.
Source name:
World Development Indicators
Source organization:
World Bank staff estimates based on age distributions of United Nations Population Division's World Population Prospects.
Categories, topics:
Education, Health
Last updated:
apr 23, 2017
Indicators value changes by year
Minimum:
20.703
jan 1, 2012
Maximum:
43.428
jan 1, 1965
At the date of observation
Value
Absolute change
Change from previous value
jan 1, 1961
42.806
+42.806
0.0%
jan 1, 1962
42.935
+0.129
0.3%
jan 1, 1963
43.114
+0.179
0.42%
jan 1, 1964
43.308
+0.195
0.45%
jan 1, 1965
43.428
+0.12
0.28%
jan 1, 1966
43.402
-0.027
-0.06%
jan 1, 1967
43.28
-0.122
-0.28%
jan 1, 1968
42.9
-0.38
-0.88%
jan 1, 1969
42.371
-0.529
-1.23%
jan 1, 1970
41.858
-0.513
-1.21%
jan 1, 1971
41.439
-0.419
-1.0%
jan 1, 1972
40.456
-0.983
-2.37%
jan 1, 1973
39.747
-0.708
-1.75%
jan 1, 1974
39.163
-0.584
-1.47%
jan 1, 1975
38.487
-0.676
-1.73%
jan 1, 1976
37.638
-0.849
-2.21%
jan 1, 1977
36.968
-0.669
-1.78%
jan 1, 1978
36.082
-0.887
-2.4%
jan 1, 1979
35.138
-0.944
-2.62%
jan 1, 1980
34.393
-0.745
-2.12%
jan 1, 1981
33.964
-0.428
-1.25%
jan 1, 1982
33.739
-0.226
-0.66%
jan 1, 1983
33.808
+0.069
0.21%
jan 1, 1984
34.05
+0.242
0.72%
jan 1, 1985
34.247
+0.197
0.58%
jan 1, 1986
34.277
+0.03
0.09%
jan 1, 1987
34.476
+0.199
0.58%
jan 1, 1988
34.404
-0.072
-0.21%
jan 1, 1989
34.147
-0.257
-0.75%
jan 1, 1990
33.852
-0.295
-0.86%
jan 1, 1991
33.583
-0.269
-0.79%
jan 1, 1992
33.004
-0.579
-1.72%
jan 1, 1993
32.545
-0.459
-1.39%
jan 1, 1994
32.103
-0.442
-1.36%
jan 1, 1995
31.527
-0.576
-1.79%
jan 1, 1996
30.754
-0.774
-2.45%
jan 1, 1997
29.85
-0.904
-2.94%
jan 1, 1998
28.807
-1.043
-3.49%
jan 1, 1999
27.677
-1.131
-3.93%
jan 1, 2000
26.574
-1.103
-3.98%
jan 1, 2001
25.575
-0.998
-3.76%
jan 1, 2002
24.617
-0.958
-3.75%
jan 1, 2003
23.767
-0.851
-3.46%
jan 1, 2004
23.029
-0.737
-3.1%
jan 1, 2005
22.391
-0.638
-2.77%
jan 1, 2006
21.844
-0.546
-2.44%
jan 1, 2007
21.466
-0.378
-1.73%
jan 1, 2008
21.16
-0.306
-1.43%
jan 1, 2009
20.935
-0.225
-1.06%
jan 1, 2010
20.794
-0.141
-0.68%
jan 1, 2011
20.723
-0.07
-0.34%
jan 1, 2012
20.703
-0.021
-0.1%
jan 1, 2013
20.719
+0.017
0.08%
jan 1, 2014
20.756
+0.036
0.18%
jan 1, 2015
20.783
+0.027
0.13%
jan 1, 2016
20.78
-0.003
-0.01%
Ranking of countries by current statistics by years


Comments: