29
/
en
AIzaSyAYiBZKx7MnpbEhh9jyipgxe19OcubqV5w
April 1, 2024
232615
Samoa
WSM
true
2
1
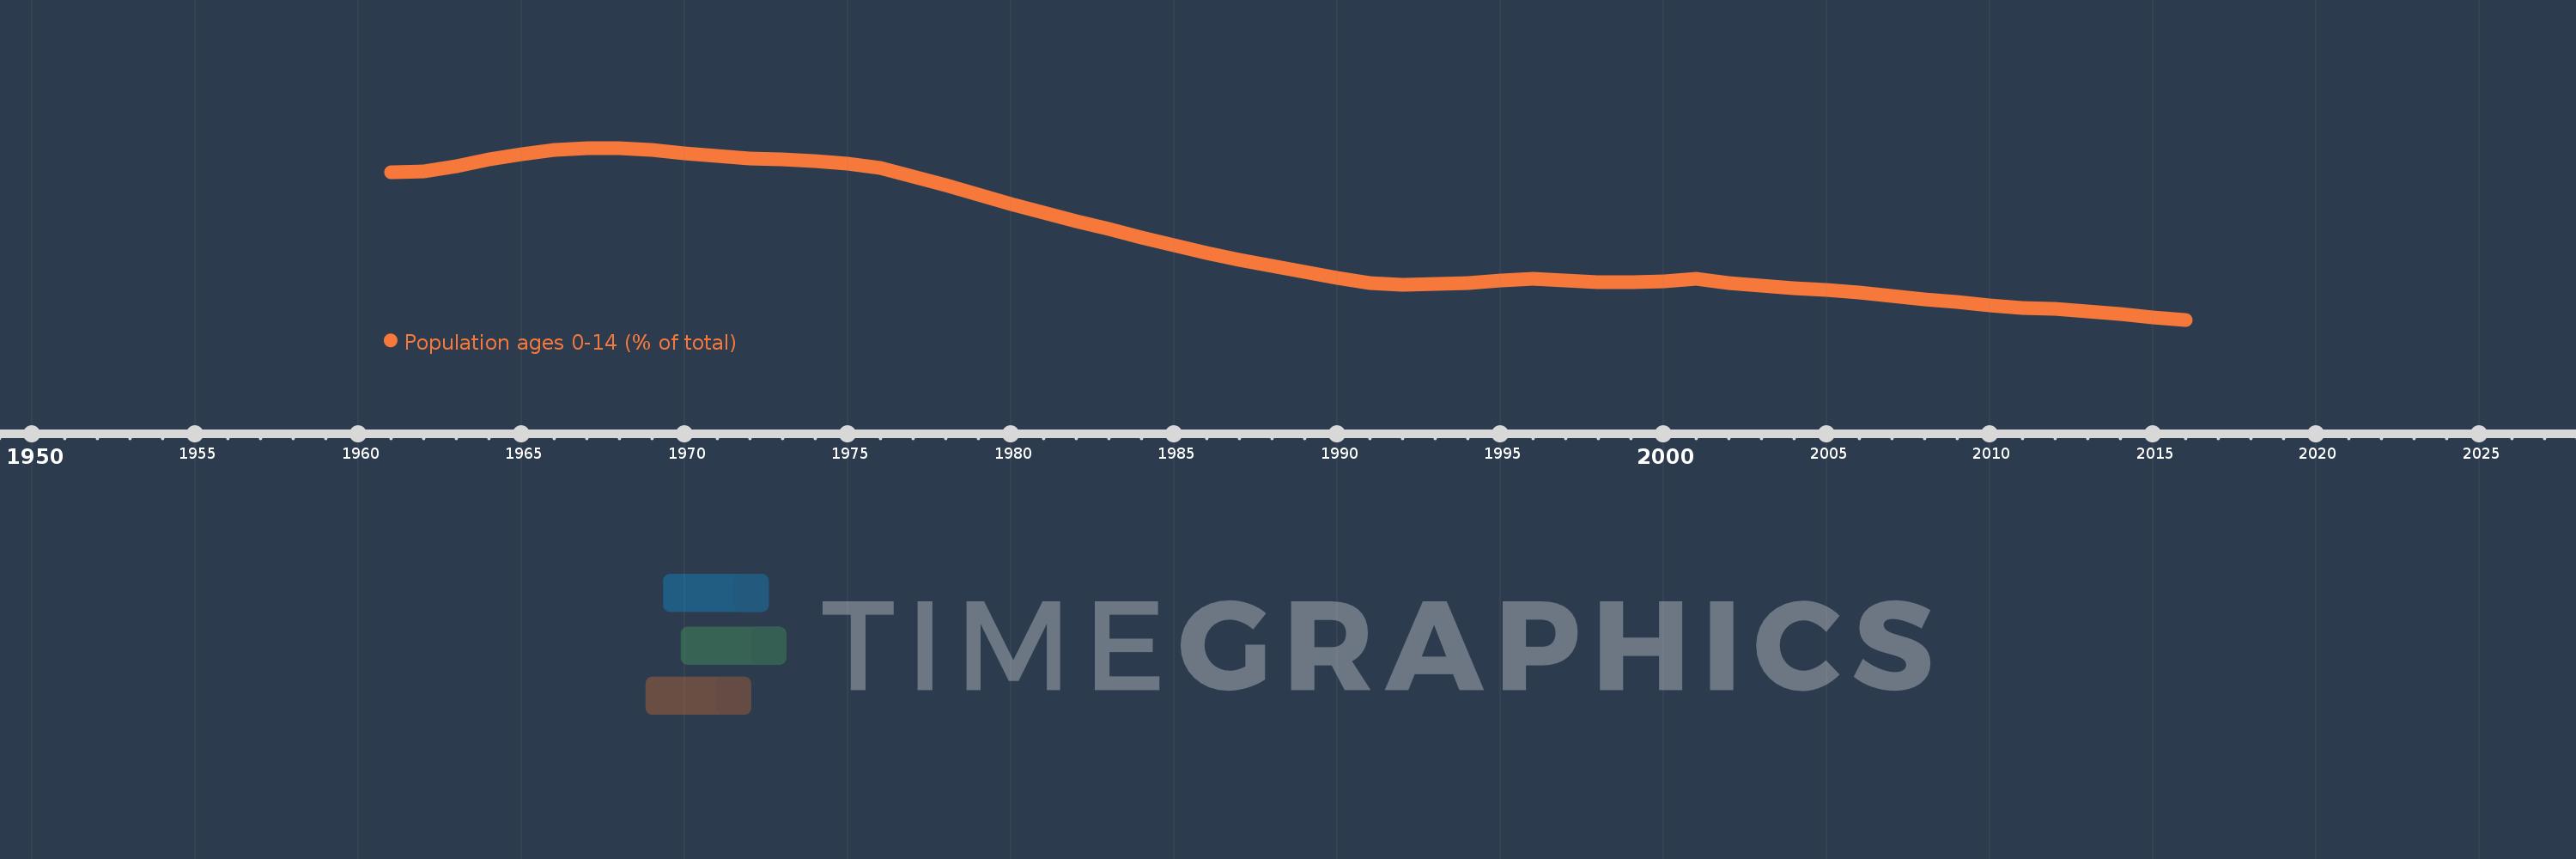
Population ages 0-14 (% of total)
2016,2015,2014,2013,2012,2011,2010,2009,2008,2007,2006,2005,2004,2003,2002,2001,2000,1999,1998,1997,1996,1995,1994,1993,1992,1991,1990,1989,1988,1987,1986,1985,1984,1983,1982,1981,1980,1979,1978,1977,1976,1975,1974,1973,1972,1971,1970,1969,1968,1967,1966,1965,1964,1963,1962,1961
This statistics in other country:
AfghanistanAlbaniaAlgeriaAngolaAntigua and BarbudaArab WorldArgentinaArmeniaArubaAustraliaAustriaAzerbaijanBahamas, TheBahrainBangladeshBarbadosBelarusBelgiumBelizeBeninBhutanBoliviaBosnia and HerzegovinaBotswanaBrazilBrunei DarussalamBulgariaBurkina FasoBurundiCabo VerdeCambodiaCameroonCanadaCaribbean small statesCentral African RepublicCentral Europe and the BalticsChadChannel IslandsChileChinaColombiaComorosCongo, Dem. Rep.Congo, Rep.Costa RicaCote d'IvoireCroatiaCubaCuracaoCyprusCzech RepublicDenmarkDjiboutiDominican RepublicEarly-demographic dividendEast Asia & PacificEast Asia & Pacific (excluding high income)East Asia & Pacific (IDA & IBRD countries)EcuadorEgypt, Arab Rep.El SalvadorEquatorial GuineaEritreaEstoniaEthiopiaEuro areaEurope & Central AsiaEurope & Central Asia (excluding high income)Europe & Central Asia (IDA & IBRD countries)European UnionFijiFinlandFragile and conflict affected situationsFranceFrench PolynesiaGabonGambia, TheGeorgiaGermanyGhanaGreeceGrenadaGuamGuatemalaGuineaGuinea-BissauGuyanaHaitiHeavily indebted poor countries (HIPC)High incomeHondurasHong Kong SAR, ChinaHungaryIBRD onlyIcelandIDA & IBRD totalIDA blendIDA onlyIDA totalIndiaIndonesiaIran, Islamic Rep.IraqIrelandIsraelItalyJamaicaJapanJordanKazakhstanKenyaKiribatiKorea, Dem. People’s Rep.Korea, Rep.KosovoKuwaitKyrgyz RepublicLao PDRLate-demographic dividendLatin America & Caribbean Latin America & Caribbean (excluding high income)Latin America & the Caribbean (IDA & IBRD countries)LatviaLeast developed countries: UN classificationLebanonLesothoLiberiaLibyaLithuaniaLow & middle incomeLow incomeLower middle incomeLuxembourgMacao SAR, ChinaMacedonia, FYRMadagascarMalawiMalaysiaMaldivesMaliMaltaMauritaniaMauritiusMexicoMicronesia, Fed. Sts.Middle East & North AfricaMiddle East & North Africa (excluding high income)Middle East & North Africa (IDA & IBRD countries)Middle incomeMoldovaMongoliaMontenegroMoroccoMozambiqueMyanmarNamibiaNepalNetherlandsNew CaledoniaNew ZealandNicaraguaNigerNigeriaNorth AmericaNorwayOECD membersOmanOther small statesPacific island small statesPakistanPanamaPapua New GuineaParaguayPeruPhilippinesPolandPortugalPost-demographic dividendPre-demographic dividendPuerto RicoQatarRomaniaRussian FederationRwandaSamoaSao Tome and PrincipeSaudi ArabiaSenegalSerbiaSeychellesSierra LeoneSingaporeSlovak RepublicSloveniaSmall statesSolomon IslandsSomaliaSouth AfricaSouth AsiaSouth Asia (IDA & IBRD)South SudanSpainSri LankaSt. LuciaSt. Vincent and the GrenadinesSub-Saharan Africa Sub-Saharan Africa (excluding high income)Sub-Saharan Africa (IDA & IBRD countries)SudanSurinameSwazilandSwedenSwitzerlandSyrian Arab RepublicTajikistanTanzaniaThailandTimor-LesteTogoTongaTrinidad and TobagoTunisiaTurkeyTurkmenistanUgandaUkraineUnited Arab EmiratesUnited KingdomUnited StatesUpper middle incomeUruguayUzbekistanVanuatuVenezuela, RBVietnamVirgin Islands (U.S.)West Bank and GazaWorldYemen, Rep.ZambiaZimbabwe Timeline:
This timeline shows a graph from 1961 to 2016 of Samoa. No data until 1960. Number of actual observations by date: 56.
Source name:
World Development Indicators
Source organization:
World Bank staff estimates based on age distributions of United Nations Population Division's World Population Prospects.
Categories, topics:
Education, Health
Last updated:
apr 23, 2017
Indicators value changes by year
Minimum:
37.291
jan 1, 2016
Maximum:
51.624
jan 1, 1968
At the date of observation
Value
Absolute change
Change from previous value
jan 1, 1961
49.561
+49.561
0.0%
jan 1, 1962
49.7
+0.138
0.28%
jan 1, 1963
50.106
+0.406
0.82%
jan 1, 1964
50.654
+0.548
1.09%
jan 1, 1965
51.133
+0.478
0.94%
jan 1, 1966
51.429
+0.297
0.58%
jan 1, 1967
51.623
+0.194
0.38%
jan 1, 1968
51.624
+0.0
0.0%
jan 1, 1969
51.444
-0.18
-0.35%
jan 1, 1970
51.188
-0.256
-0.5%
jan 1, 1971
50.926
-0.261
-0.51%
jan 1, 1972
50.742
-0.184
-0.36%
jan 1, 1973
50.642
-0.1
-0.2%
jan 1, 1974
50.525
-0.117
-0.23%
jan 1, 1975
50.299
-0.226
-0.45%
jan 1, 1976
49.936
-0.364
-0.72%
jan 1, 1977
49.27
-0.666
-1.33%
jan 1, 1978
48.549
-0.72
-1.46%
jan 1, 1979
47.768
-0.782
-1.61%
jan 1, 1980
46.976
-0.792
-1.66%
jan 1, 1981
46.227
-0.749
-1.59%
jan 1, 1982
45.519
-0.708
-1.53%
jan 1, 1983
44.847
-0.672
-1.48%
jan 1, 1984
44.17
-0.676
-1.51%
jan 1, 1985
43.494
-0.677
-1.53%
jan 1, 1986
42.846
-0.647
-1.49%
jan 1, 1987
42.291
-0.555
-1.3%
jan 1, 1988
41.796
-0.496
-1.17%
jan 1, 1989
41.292
-0.504
-1.21%
jan 1, 1990
40.792
-0.5
-1.21%
jan 1, 1991
40.363
-0.428
-1.05%
jan 1, 1992
40.221
-0.142
-0.35%
jan 1, 1993
40.246
+0.025
0.06%
jan 1, 1994
40.372
+0.126
0.31%
jan 1, 1995
40.534
+0.161
0.4%
jan 1, 1996
40.694
+0.16
0.4%
jan 1, 1997
40.536
-0.158
-0.39%
jan 1, 1998
40.442
-0.095
-0.23%
jan 1, 1999
40.431
-0.011
-0.03%
jan 1, 2000
40.53
+0.099
0.24%
jan 1, 2001
40.721
+0.191
0.47%
jan 1, 2002
40.345
-0.377
-0.92%
jan 1, 2003
40.105
-0.239
-0.59%
jan 1, 2004
39.934
-0.171
-0.43%
jan 1, 2005
39.763
-0.172
-0.43%
jan 1, 2006
39.566
-0.196
-0.49%
jan 1, 2007
39.288
-0.279
-0.7%
jan 1, 2008
39.024
-0.263
-0.67%
jan 1, 2009
38.768
-0.256
-0.66%
jan 1, 2010
38.519
-0.249
-0.64%
jan 1, 2011
38.275
-0.243
-0.63%
jan 1, 2012
38.212
-0.063
-0.17%
jan 1, 2013
38.015
-0.197
-0.51%
jan 1, 2014
37.751
-0.264
-0.7%
jan 1, 2015
37.501
-0.25
-0.66%
jan 1, 2016
37.291
-0.21
-0.56%
Ranking of countries by current statistics by years


Comments: