29
/
en
AIzaSyAYiBZKx7MnpbEhh9jyipgxe19OcubqV5w
April 1, 2024
184362
Macedonia, FYR
MKD
true
2
1
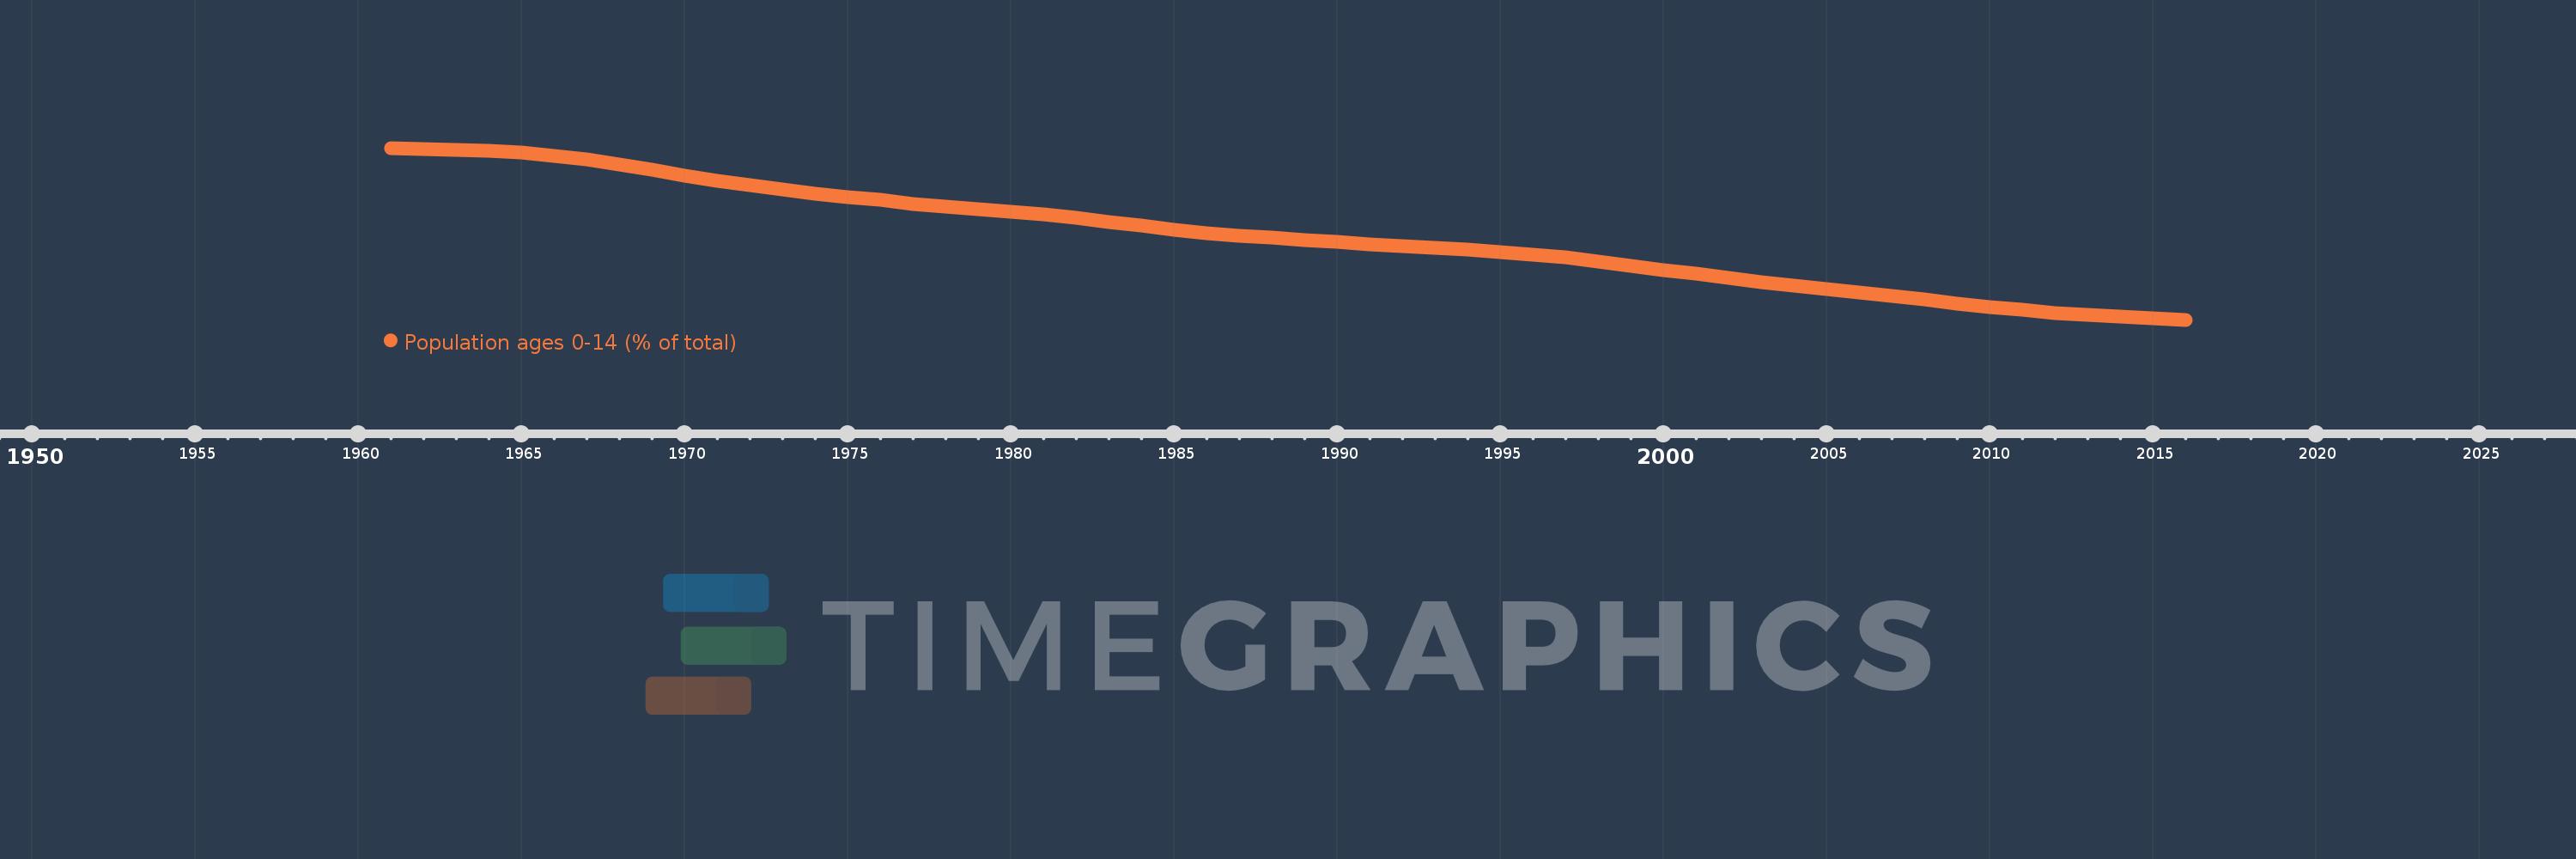
Population ages 0-14 (% of total)
2016,2015,2014,2013,2012,2011,2010,2009,2008,2007,2006,2005,2004,2003,2002,2001,2000,1999,1998,1997,1996,1995,1994,1993,1992,1991,1990,1989,1988,1987,1986,1985,1984,1983,1982,1981,1980,1979,1978,1977,1976,1975,1974,1973,1972,1971,1970,1969,1968,1967,1966,1965,1964,1963,1962,1961
This statistics in other country:
AfghanistanAlbaniaAlgeriaAngolaAntigua and BarbudaArab WorldArgentinaArmeniaArubaAustraliaAustriaAzerbaijanBahamas, TheBahrainBangladeshBarbadosBelarusBelgiumBelizeBeninBhutanBoliviaBosnia and HerzegovinaBotswanaBrazilBrunei DarussalamBulgariaBurkina FasoBurundiCabo VerdeCambodiaCameroonCanadaCaribbean small statesCentral African RepublicCentral Europe and the BalticsChadChannel IslandsChileChinaColombiaComorosCongo, Dem. Rep.Congo, Rep.Costa RicaCote d'IvoireCroatiaCubaCuracaoCyprusCzech RepublicDenmarkDjiboutiDominican RepublicEarly-demographic dividendEast Asia & PacificEast Asia & Pacific (excluding high income)East Asia & Pacific (IDA & IBRD countries)EcuadorEgypt, Arab Rep.El SalvadorEquatorial GuineaEritreaEstoniaEthiopiaEuro areaEurope & Central AsiaEurope & Central Asia (excluding high income)Europe & Central Asia (IDA & IBRD countries)European UnionFijiFinlandFragile and conflict affected situationsFranceFrench PolynesiaGabonGambia, TheGeorgiaGermanyGhanaGreeceGrenadaGuamGuatemalaGuineaGuinea-BissauGuyanaHaitiHeavily indebted poor countries (HIPC)High incomeHondurasHong Kong SAR, ChinaHungaryIBRD onlyIcelandIDA & IBRD totalIDA blendIDA onlyIDA totalIndiaIndonesiaIran, Islamic Rep.IraqIrelandIsraelItalyJamaicaJapanJordanKazakhstanKenyaKiribatiKorea, Dem. People’s Rep.Korea, Rep.KosovoKuwaitKyrgyz RepublicLao PDRLate-demographic dividendLatin America & Caribbean Latin America & Caribbean (excluding high income)Latin America & the Caribbean (IDA & IBRD countries)LatviaLeast developed countries: UN classificationLebanonLesothoLiberiaLibyaLithuaniaLow & middle incomeLow incomeLower middle incomeLuxembourgMacao SAR, ChinaMacedonia, FYRMadagascarMalawiMalaysiaMaldivesMaliMaltaMauritaniaMauritiusMexicoMicronesia, Fed. Sts.Middle East & North AfricaMiddle East & North Africa (excluding high income)Middle East & North Africa (IDA & IBRD countries)Middle incomeMoldovaMongoliaMontenegroMoroccoMozambiqueMyanmarNamibiaNepalNetherlandsNew CaledoniaNew ZealandNicaraguaNigerNigeriaNorth AmericaNorwayOECD membersOmanOther small statesPacific island small statesPakistanPanamaPapua New GuineaParaguayPeruPhilippinesPolandPortugalPost-demographic dividendPre-demographic dividendPuerto RicoQatarRomaniaRussian FederationRwandaSamoaSao Tome and PrincipeSaudi ArabiaSenegalSerbiaSeychellesSierra LeoneSingaporeSlovak RepublicSloveniaSmall statesSolomon IslandsSomaliaSouth AfricaSouth AsiaSouth Asia (IDA & IBRD)South SudanSpainSri LankaSt. LuciaSt. Vincent and the GrenadinesSub-Saharan Africa Sub-Saharan Africa (excluding high income)Sub-Saharan Africa (IDA & IBRD countries)SudanSurinameSwazilandSwedenSwitzerlandSyrian Arab RepublicTajikistanTanzaniaThailandTimor-LesteTogoTongaTrinidad and TobagoTunisiaTurkeyTurkmenistanUgandaUkraineUnited Arab EmiratesUnited KingdomUnited StatesUpper middle incomeUruguayUzbekistanVanuatuVenezuela, RBVietnamVirgin Islands (U.S.)West Bank and GazaWorldYemen, Rep.ZambiaZimbabwe Timeline:
This timeline shows a graph from 1961 to 2016 of Macedonia, FYR. No data until 1960. Number of actual observations by date: 56.
Source name:
World Development Indicators
Source organization:
World Bank staff estimates based on age distributions of United Nations Population Division's World Population Prospects.
Categories, topics:
Education, Health
Last updated:
apr 23, 2017
Indicators value changes by year
Minimum:
16.953
jan 1, 2016
Maximum:
37.992
jan 1, 1961
At the date of observation
Value
Absolute change
Change from previous value
jan 1, 1961
37.992
+37.992
0.0%
jan 1, 1962
37.815
-0.177
-0.47%
jan 1, 1963
37.732
-0.083
-0.22%
jan 1, 1964
37.645
-0.087
-0.23%
jan 1, 1965
37.429
-0.216
-0.57%
jan 1, 1966
37.042
-0.386
-1.03%
jan 1, 1967
36.586
-0.457
-1.23%
jan 1, 1968
36.0
-0.586
-1.6%
jan 1, 1969
35.328
-0.672
-1.87%
jan 1, 1970
34.646
-0.682
-1.93%
jan 1, 1971
33.995
-0.651
-1.88%
jan 1, 1972
33.467
-0.528
-1.55%
jan 1, 1973
32.908
-0.559
-1.67%
jan 1, 1974
32.381
-0.527
-1.6%
jan 1, 1975
31.939
-0.441
-1.36%
jan 1, 1976
31.597
-0.343
-1.07%
jan 1, 1977
31.123
-0.474
-1.5%
jan 1, 1978
30.787
-0.336
-1.08%
jan 1, 1979
30.517
-0.27
-0.88%
jan 1, 1980
30.212
-0.305
-1.0%
jan 1, 1981
29.824
-0.388
-1.28%
jan 1, 1982
29.417
-0.407
-1.37%
jan 1, 1983
28.96
-0.457
-1.56%
jan 1, 1984
28.471
-0.489
-1.69%
jan 1, 1985
27.999
-0.472
-1.66%
jan 1, 1986
27.57
-0.429
-1.53%
jan 1, 1987
27.276
-0.294
-1.07%
jan 1, 1988
26.983
-0.293
-1.07%
jan 1, 1989
26.704
-0.279
-1.03%
jan 1, 1990
26.443
-0.261
-0.98%
jan 1, 1991
26.191
-0.253
-0.96%
jan 1, 1992
25.968
-0.223
-0.85%
jan 1, 1993
25.769
-0.198
-0.76%
jan 1, 1994
25.554
-0.215
-0.84%
jan 1, 1995
25.278
-0.276
-1.08%
jan 1, 1996
24.937
-0.341
-1.35%
jan 1, 1997
24.557
-0.38
-1.52%
jan 1, 1998
24.075
-0.483
-1.97%
jan 1, 1999
23.541
-0.533
-2.22%
jan 1, 2000
23.024
-0.517
-2.2%
jan 1, 2001
22.551
-0.473
-2.06%
jan 1, 2002
22.028
-0.523
-2.32%
jan 1, 2003
21.577
-0.451
-2.05%
jan 1, 2004
21.171
-0.407
-1.89%
jan 1, 2005
20.755
-0.415
-1.96%
jan 1, 2006
20.306
-0.449
-2.16%
jan 1, 2007
19.901
-0.405
-1.99%
jan 1, 2008
19.444
-0.457
-2.29%
jan 1, 2009
18.967
-0.477
-2.45%
jan 1, 2010
18.526
-0.441
-2.33%
jan 1, 2011
18.152
-0.374
-2.02%
jan 1, 2012
17.79
-0.362
-1.99%
jan 1, 2013
17.527
-0.264
-1.48%
jan 1, 2014
17.33
-0.196
-1.12%
jan 1, 2015
17.147
-0.183
-1.06%
jan 1, 2016
16.953
-0.194
-1.13%
Ranking of countries by current statistics by years


Comments: