29
/
en
AIzaSyAYiBZKx7MnpbEhh9jyipgxe19OcubqV5w
April 1, 2024
236263
Senegal
SEN
true
2
1
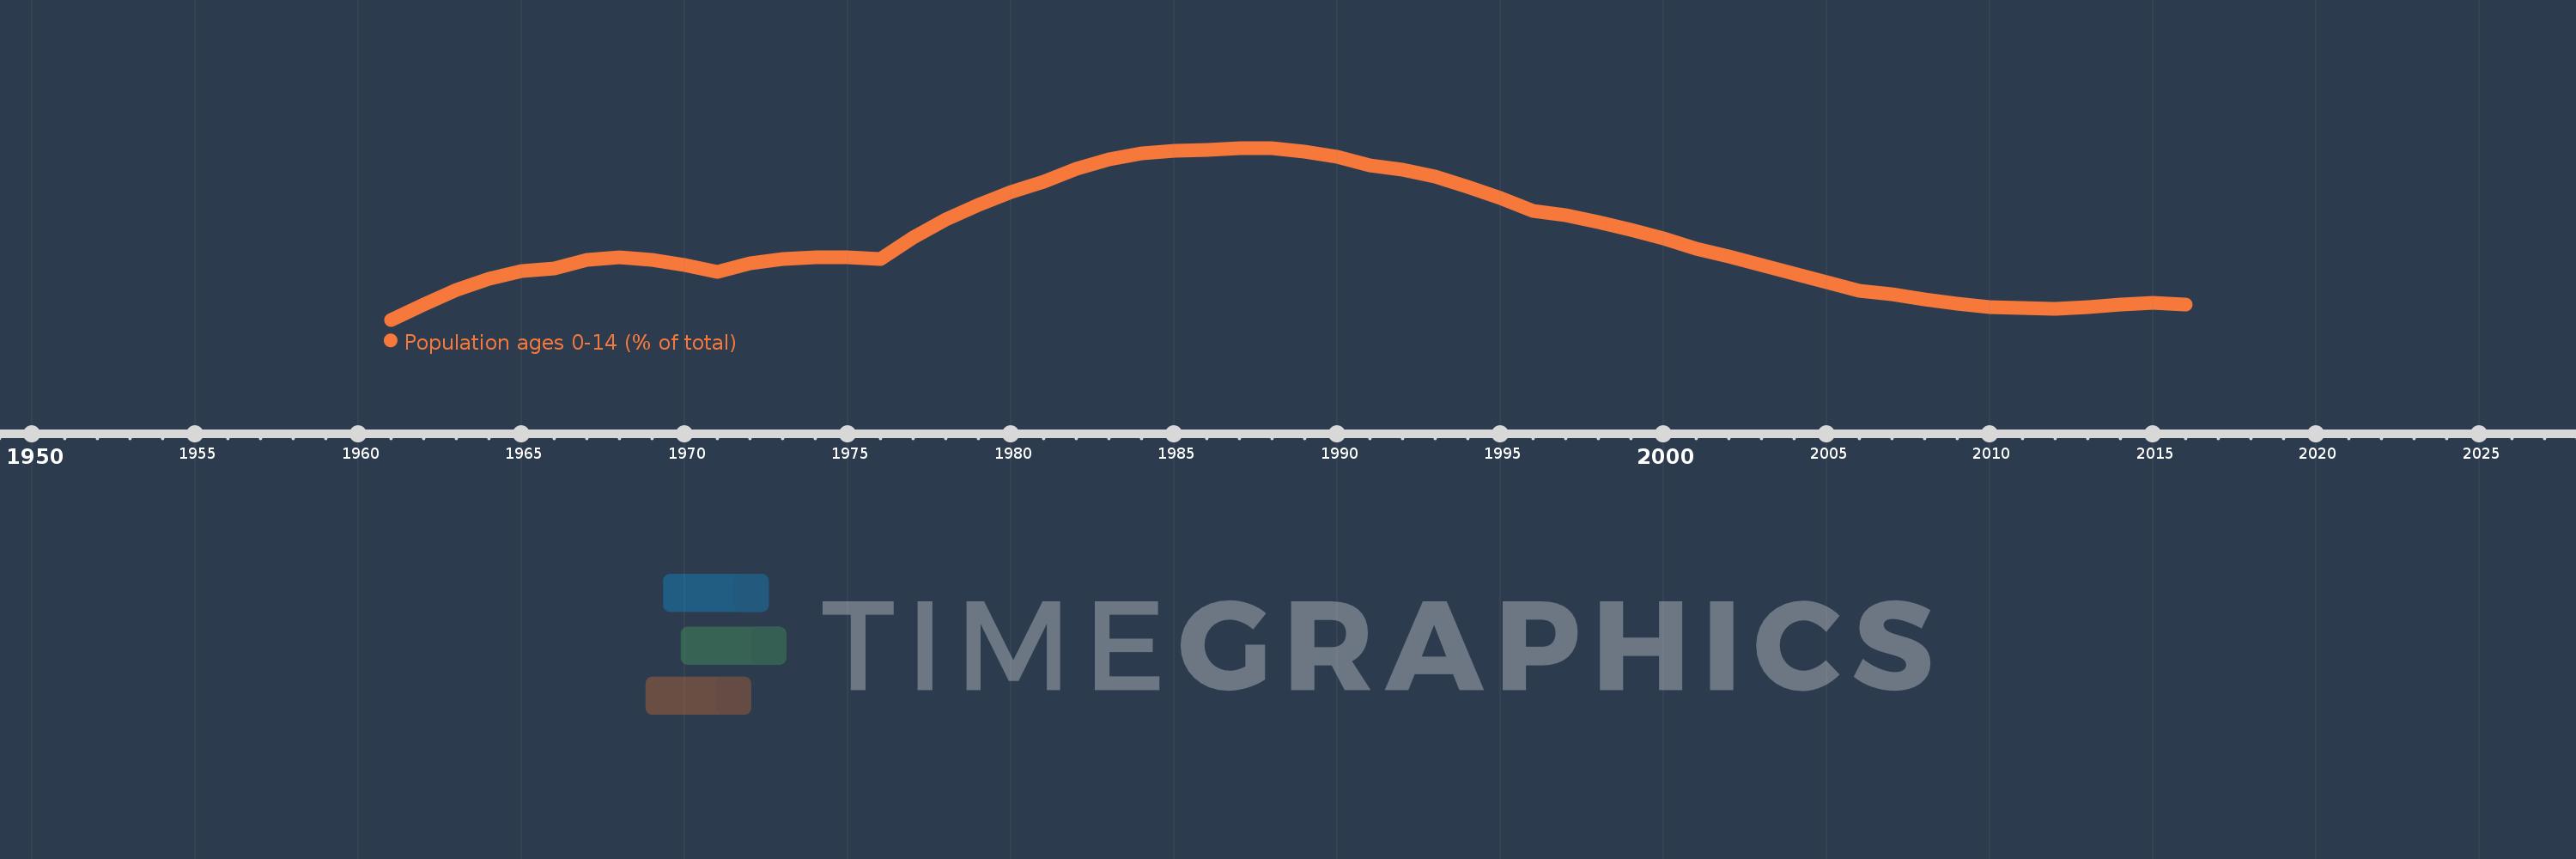
Population ages 0-14 (% of total)
2016,2015,2014,2013,2012,2011,2010,2009,2008,2007,2006,2005,2004,2003,2002,2001,2000,1999,1998,1997,1996,1995,1994,1993,1992,1991,1990,1989,1988,1987,1986,1985,1984,1983,1982,1981,1980,1979,1978,1977,1976,1975,1974,1973,1972,1971,1970,1969,1968,1967,1966,1965,1964,1963,1962,1961
This statistics in other country:
AfghanistanAlbaniaAlgeriaAngolaAntigua and BarbudaArab WorldArgentinaArmeniaArubaAustraliaAustriaAzerbaijanBahamas, TheBahrainBangladeshBarbadosBelarusBelgiumBelizeBeninBhutanBoliviaBosnia and HerzegovinaBotswanaBrazilBrunei DarussalamBulgariaBurkina FasoBurundiCabo VerdeCambodiaCameroonCanadaCaribbean small statesCentral African RepublicCentral Europe and the BalticsChadChannel IslandsChileChinaColombiaComorosCongo, Dem. Rep.Congo, Rep.Costa RicaCote d'IvoireCroatiaCubaCuracaoCyprusCzech RepublicDenmarkDjiboutiDominican RepublicEarly-demographic dividendEast Asia & PacificEast Asia & Pacific (excluding high income)East Asia & Pacific (IDA & IBRD countries)EcuadorEgypt, Arab Rep.El SalvadorEquatorial GuineaEritreaEstoniaEthiopiaEuro areaEurope & Central AsiaEurope & Central Asia (excluding high income)Europe & Central Asia (IDA & IBRD countries)European UnionFijiFinlandFragile and conflict affected situationsFranceFrench PolynesiaGabonGambia, TheGeorgiaGermanyGhanaGreeceGrenadaGuamGuatemalaGuineaGuinea-BissauGuyanaHaitiHeavily indebted poor countries (HIPC)High incomeHondurasHong Kong SAR, ChinaHungaryIBRD onlyIcelandIDA & IBRD totalIDA blendIDA onlyIDA totalIndiaIndonesiaIran, Islamic Rep.IraqIrelandIsraelItalyJamaicaJapanJordanKazakhstanKenyaKiribatiKorea, Dem. People’s Rep.Korea, Rep.KosovoKuwaitKyrgyz RepublicLao PDRLate-demographic dividendLatin America & Caribbean Latin America & Caribbean (excluding high income)Latin America & the Caribbean (IDA & IBRD countries)LatviaLeast developed countries: UN classificationLebanonLesothoLiberiaLibyaLithuaniaLow & middle incomeLow incomeLower middle incomeLuxembourgMacao SAR, ChinaMacedonia, FYRMadagascarMalawiMalaysiaMaldivesMaliMaltaMauritaniaMauritiusMexicoMicronesia, Fed. Sts.Middle East & North AfricaMiddle East & North Africa (excluding high income)Middle East & North Africa (IDA & IBRD countries)Middle incomeMoldovaMongoliaMontenegroMoroccoMozambiqueMyanmarNamibiaNepalNetherlandsNew CaledoniaNew ZealandNicaraguaNigerNigeriaNorth AmericaNorwayOECD membersOmanOther small statesPacific island small statesPakistanPanamaPapua New GuineaParaguayPeruPhilippinesPolandPortugalPost-demographic dividendPre-demographic dividendPuerto RicoQatarRomaniaRussian FederationRwandaSamoaSao Tome and PrincipeSaudi ArabiaSenegalSerbiaSeychellesSierra LeoneSingaporeSlovak RepublicSloveniaSmall statesSolomon IslandsSomaliaSouth AfricaSouth AsiaSouth Asia (IDA & IBRD)South SudanSpainSri LankaSt. LuciaSt. Vincent and the GrenadinesSub-Saharan Africa Sub-Saharan Africa (excluding high income)Sub-Saharan Africa (IDA & IBRD countries)SudanSurinameSwazilandSwedenSwitzerlandSyrian Arab RepublicTajikistanTanzaniaThailandTimor-LesteTogoTongaTrinidad and TobagoTunisiaTurkeyTurkmenistanUgandaUkraineUnited Arab EmiratesUnited KingdomUnited StatesUpper middle incomeUruguayUzbekistanVanuatuVenezuela, RBVietnamVirgin Islands (U.S.)West Bank and GazaWorldYemen, Rep.ZambiaZimbabwe Timeline:
This timeline shows a graph from 1961 to 2016 of Senegal. No data until 1960. Number of actual observations by date: 56.
Source name:
World Development Indicators
Source organization:
World Bank staff estimates based on age distributions of United Nations Population Division's World Population Prospects.
Categories, topics:
Education, Health
Last updated:
apr 23, 2017
Indicators value changes by year
Minimum:
43.392
jan 1, 1961
Maximum:
47.539
jan 1, 1987
At the date of observation
Value
Absolute change
Change from previous value
jan 1, 1961
43.392
+43.392
0.0%
jan 1, 1962
43.766
+0.374
0.86%
jan 1, 1963
44.103
+0.337
0.77%
jan 1, 1964
44.386
+0.283
0.64%
jan 1, 1965
44.566
+0.18
0.41%
jan 1, 1966
44.62
+0.054
0.12%
jan 1, 1967
44.841
+0.221
0.49%
jan 1, 1968
44.898
+0.057
0.13%
jan 1, 1969
44.835
-0.063
-0.14%
jan 1, 1970
44.707
-0.128
-0.28%
jan 1, 1971
44.551
-0.156
-0.35%
jan 1, 1972
44.745
+0.194
0.44%
jan 1, 1973
44.851
+0.106
0.24%
jan 1, 1974
44.895
+0.044
0.1%
jan 1, 1975
44.891
-0.004
-0.01%
jan 1, 1976
44.848
-0.043
-0.1%
jan 1, 1977
45.386
+0.538
1.2%
jan 1, 1978
45.816
+0.43
0.95%
jan 1, 1979
46.167
+0.352
0.77%
jan 1, 1980
46.465
+0.297
0.64%
jan 1, 1981
46.714
+0.249
0.54%
jan 1, 1982
47.041
+0.327
0.7%
jan 1, 1983
47.264
+0.223
0.47%
jan 1, 1984
47.403
+0.139
0.29%
jan 1, 1985
47.473
+0.071
0.15%
jan 1, 1986
47.486
+0.012
0.03%
jan 1, 1987
47.539
+0.054
0.11%
jan 1, 1988
47.528
-0.012
-0.02%
jan 1, 1989
47.455
-0.073
-0.15%
jan 1, 1990
47.318
-0.137
-0.29%
jan 1, 1991
47.118
-0.2
-0.42%
jan 1, 1992
47.023
-0.095
-0.2%
jan 1, 1993
46.844
-0.179
-0.38%
jan 1, 1994
46.604
-0.24
-0.51%
jan 1, 1995
46.327
-0.278
-0.6%
jan 1, 1996
46.019
-0.308
-0.66%
jan 1, 1997
45.909
-0.11
-0.24%
jan 1, 1998
45.759
-0.15
-0.33%
jan 1, 1999
45.571
-0.189
-0.41%
jan 1, 2000
45.349
-0.221
-0.49%
jan 1, 2001
45.107
-0.243
-0.54%
jan 1, 2002
44.92
-0.186
-0.41%
jan 1, 2003
44.718
-0.202
-0.45%
jan 1, 2004
44.508
-0.21
-0.47%
jan 1, 2005
44.294
-0.214
-0.48%
jan 1, 2006
44.083
-0.211
-0.48%
jan 1, 2007
43.998
-0.085
-0.19%
jan 1, 2008
43.886
-0.112
-0.26%
jan 1, 2009
43.772
-0.114
-0.26%
jan 1, 2010
43.693
-0.079
-0.18%
jan 1, 2011
43.668
-0.026
-0.06%
jan 1, 2012
43.652
-0.016
-0.04%
jan 1, 2013
43.695
+0.043
0.1%
jan 1, 2014
43.762
+0.067
0.15%
jan 1, 2015
43.795
+0.033
0.07%
jan 1, 2016
43.762
-0.033
-0.07%
Ranking of countries by current statistics by years


Comments: