29
/
en
AIzaSyAYiBZKx7MnpbEhh9jyipgxe19OcubqV5w
April 1, 2024
26043
Central Europe and the Baltics
CEB
false
2
1
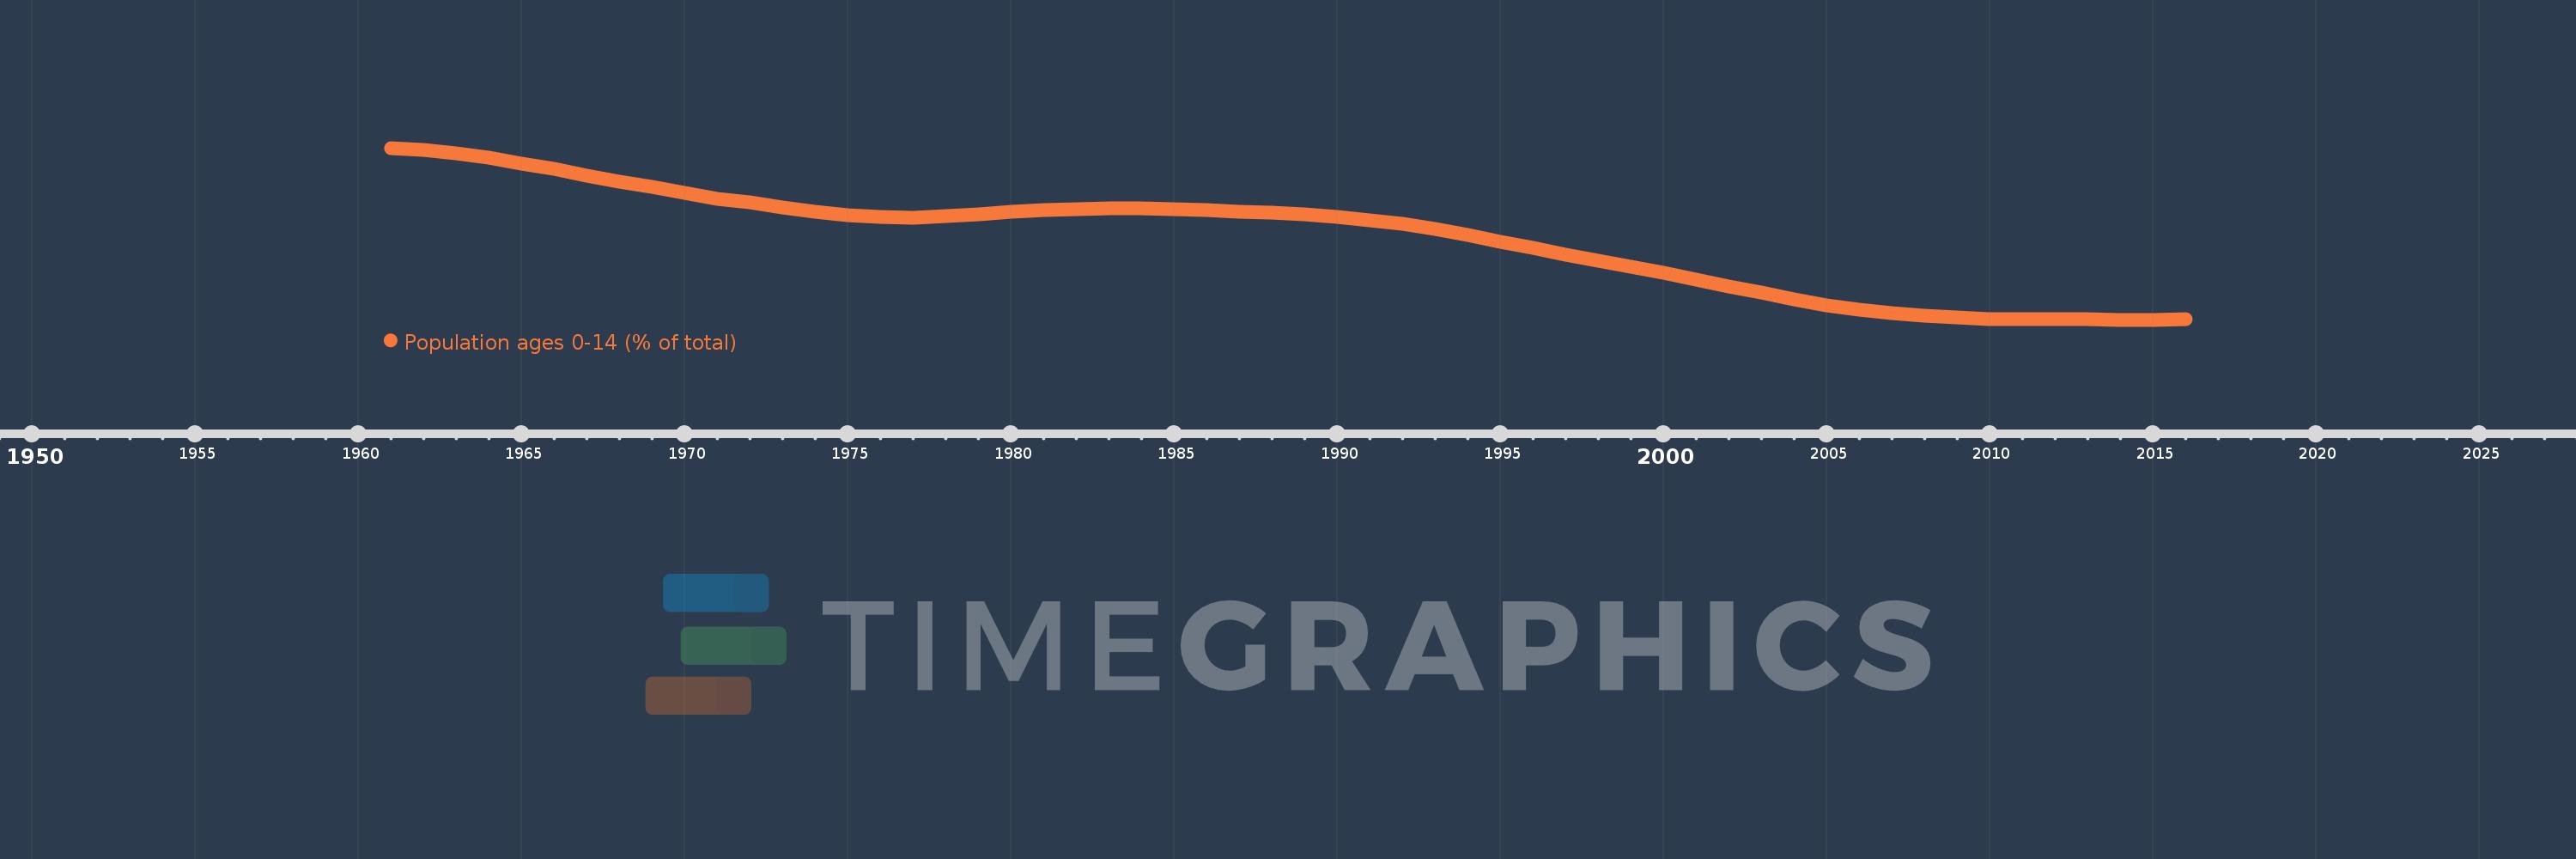
Population ages 0-14 (% of total)
2016,2015,2014,2013,2012,2011,2010,2009,2008,2007,2006,2005,2004,2003,2002,2001,2000,1999,1998,1997,1996,1995,1994,1993,1992,1991,1990,1989,1988,1987,1986,1985,1984,1983,1982,1981,1980,1979,1978,1977,1976,1975,1974,1973,1972,1971,1970,1969,1968,1967,1966,1965,1964,1963,1962,1961
This statistics in other country:
AfghanistanAlbaniaAlgeriaAngolaAntigua and BarbudaArab WorldArgentinaArmeniaArubaAustraliaAustriaAzerbaijanBahamas, TheBahrainBangladeshBarbadosBelarusBelgiumBelizeBeninBhutanBoliviaBosnia and HerzegovinaBotswanaBrazilBrunei DarussalamBulgariaBurkina FasoBurundiCabo VerdeCambodiaCameroonCanadaCaribbean small statesCentral African RepublicCentral Europe and the BalticsChadChannel IslandsChileChinaColombiaComorosCongo, Dem. Rep.Congo, Rep.Costa RicaCote d'IvoireCroatiaCubaCuracaoCyprusCzech RepublicDenmarkDjiboutiDominican RepublicEarly-demographic dividendEast Asia & PacificEast Asia & Pacific (excluding high income)East Asia & Pacific (IDA & IBRD countries)EcuadorEgypt, Arab Rep.El SalvadorEquatorial GuineaEritreaEstoniaEthiopiaEuro areaEurope & Central AsiaEurope & Central Asia (excluding high income)Europe & Central Asia (IDA & IBRD countries)European UnionFijiFinlandFragile and conflict affected situationsFranceFrench PolynesiaGabonGambia, TheGeorgiaGermanyGhanaGreeceGrenadaGuamGuatemalaGuineaGuinea-BissauGuyanaHaitiHeavily indebted poor countries (HIPC)High incomeHondurasHong Kong SAR, ChinaHungaryIBRD onlyIcelandIDA & IBRD totalIDA blendIDA onlyIDA totalIndiaIndonesiaIran, Islamic Rep.IraqIrelandIsraelItalyJamaicaJapanJordanKazakhstanKenyaKiribatiKorea, Dem. People’s Rep.Korea, Rep.KosovoKuwaitKyrgyz RepublicLao PDRLate-demographic dividendLatin America & Caribbean Latin America & Caribbean (excluding high income)Latin America & the Caribbean (IDA & IBRD countries)LatviaLeast developed countries: UN classificationLebanonLesothoLiberiaLibyaLithuaniaLow & middle incomeLow incomeLower middle incomeLuxembourgMacao SAR, ChinaMacedonia, FYRMadagascarMalawiMalaysiaMaldivesMaliMaltaMauritaniaMauritiusMexicoMicronesia, Fed. Sts.Middle East & North AfricaMiddle East & North Africa (excluding high income)Middle East & North Africa (IDA & IBRD countries)Middle incomeMoldovaMongoliaMontenegroMoroccoMozambiqueMyanmarNamibiaNepalNetherlandsNew CaledoniaNew ZealandNicaraguaNigerNigeriaNorth AmericaNorwayOECD membersOmanOther small statesPacific island small statesPakistanPanamaPapua New GuineaParaguayPeruPhilippinesPolandPortugalPost-demographic dividendPre-demographic dividendPuerto RicoQatarRomaniaRussian FederationRwandaSamoaSao Tome and PrincipeSaudi ArabiaSenegalSerbiaSeychellesSierra LeoneSingaporeSlovak RepublicSloveniaSmall statesSolomon IslandsSomaliaSouth AfricaSouth AsiaSouth Asia (IDA & IBRD)South SudanSpainSri LankaSt. LuciaSt. Vincent and the GrenadinesSub-Saharan Africa Sub-Saharan Africa (excluding high income)Sub-Saharan Africa (IDA & IBRD countries)SudanSurinameSwazilandSwedenSwitzerlandSyrian Arab RepublicTajikistanTanzaniaThailandTimor-LesteTogoTongaTrinidad and TobagoTunisiaTurkeyTurkmenistanUgandaUkraineUnited Arab EmiratesUnited KingdomUnited StatesUpper middle incomeUruguayUzbekistanVanuatuVenezuela, RBVietnamVirgin Islands (U.S.)West Bank and GazaWorldYemen, Rep.ZambiaZimbabwe Timeline:
This timeline shows a graph from 1961 to 2016 of Central Europe and the Baltics. No data until 1960. Number of actual observations by date: 56.
Source name:
World Development Indicators
Source organization:
World Bank staff estimates based on age distributions of United Nations Population Division's World Population Prospects.
Categories, topics:
Education, Health
Last updated:
apr 23, 2017
Indicators value changes by year
Minimum:
14.907
jan 1, 2014
Maximum:
29.223
jan 1, 1961
At the date of observation
Value
Absolute change
Change from previous value
jan 1, 1961
29.223
+29.223
0.0%
jan 1, 1962
29.085
-0.138
-0.47%
jan 1, 1963
28.796
-0.289
-0.99%
jan 1, 1964
28.387
-0.409
-1.42%
jan 1, 1965
27.925
-0.462
-1.63%
jan 1, 1966
27.452
-0.473
-1.69%
jan 1, 1967
26.88
-0.572
-2.08%
jan 1, 1968
26.396
-0.484
-1.8%
jan 1, 1969
25.952
-0.444
-1.68%
jan 1, 1970
25.483
-0.468
-1.8%
jan 1, 1971
24.979
-0.505
-1.98%
jan 1, 1972
24.674
-0.305
-1.22%
jan 1, 1973
24.284
-0.39
-1.58%
jan 1, 1974
23.886
-0.398
-1.64%
jan 1, 1975
23.591
-0.296
-1.24%
jan 1, 1976
23.447
-0.144
-0.61%
jan 1, 1977
23.413
-0.033
-0.14%
jan 1, 1978
23.516
+0.103
0.44%
jan 1, 1979
23.708
+0.192
0.82%
jan 1, 1980
23.892
+0.184
0.78%
jan 1, 1981
24.013
+0.121
0.51%
jan 1, 1982
24.147
+0.134
0.56%
jan 1, 1983
24.192
+0.045
0.18%
jan 1, 1984
24.169
-0.023
-0.09%
jan 1, 1985
24.125
-0.044
-0.18%
jan 1, 1986
24.08
-0.045
-0.19%
jan 1, 1987
23.939
-0.141
-0.59%
jan 1, 1988
23.83
-0.109
-0.46%
jan 1, 1989
23.706
-0.125
-0.52%
jan 1, 1990
23.504
-0.202
-0.85%
jan 1, 1991
23.192
-0.312
-1.33%
jan 1, 1992
22.901
-0.291
-1.26%
jan 1, 1993
22.474
-0.426
-1.86%
jan 1, 1994
21.956
-0.519
-2.31%
jan 1, 1995
21.424
-0.532
-2.42%
jan 1, 1996
20.911
-0.513
-2.39%
jan 1, 1997
20.357
-0.554
-2.65%
jan 1, 1998
19.834
-0.523
-2.57%
jan 1, 1999
19.329
-0.505
-2.54%
jan 1, 2000
18.804
-0.525
-2.72%
jan 1, 2001
18.251
-0.553
-2.94%
jan 1, 2002
17.7
-0.551
-3.02%
jan 1, 2003
17.15
-0.55
-3.11%
jan 1, 2004
16.617
-0.533
-3.11%
jan 1, 2005
16.138
-0.479
-2.88%
jan 1, 2006
15.737
-0.4
-2.48%
jan 1, 2007
15.429
-0.309
-1.96%
jan 1, 2008
15.214
-0.214
-1.39%
jan 1, 2009
15.078
-0.136
-0.89%
jan 1, 2010
14.99
-0.089
-0.59%
jan 1, 2011
14.924
-0.066
-0.44%
jan 1, 2012
14.94
+0.016
0.11%
jan 1, 2013
14.926
-0.014
-0.09%
jan 1, 2014
14.907
-0.019
-0.13%
jan 1, 2015
14.92
+0.013
0.09%
jan 1, 2016
14.979
+0.059
0.4%
Ranking of countries by current statistics by years


Comments: