29
/
en
AIzaSyAYiBZKx7MnpbEhh9jyipgxe19OcubqV5w
April 1, 2024
36908
IBRD only
IBD
false
2
1
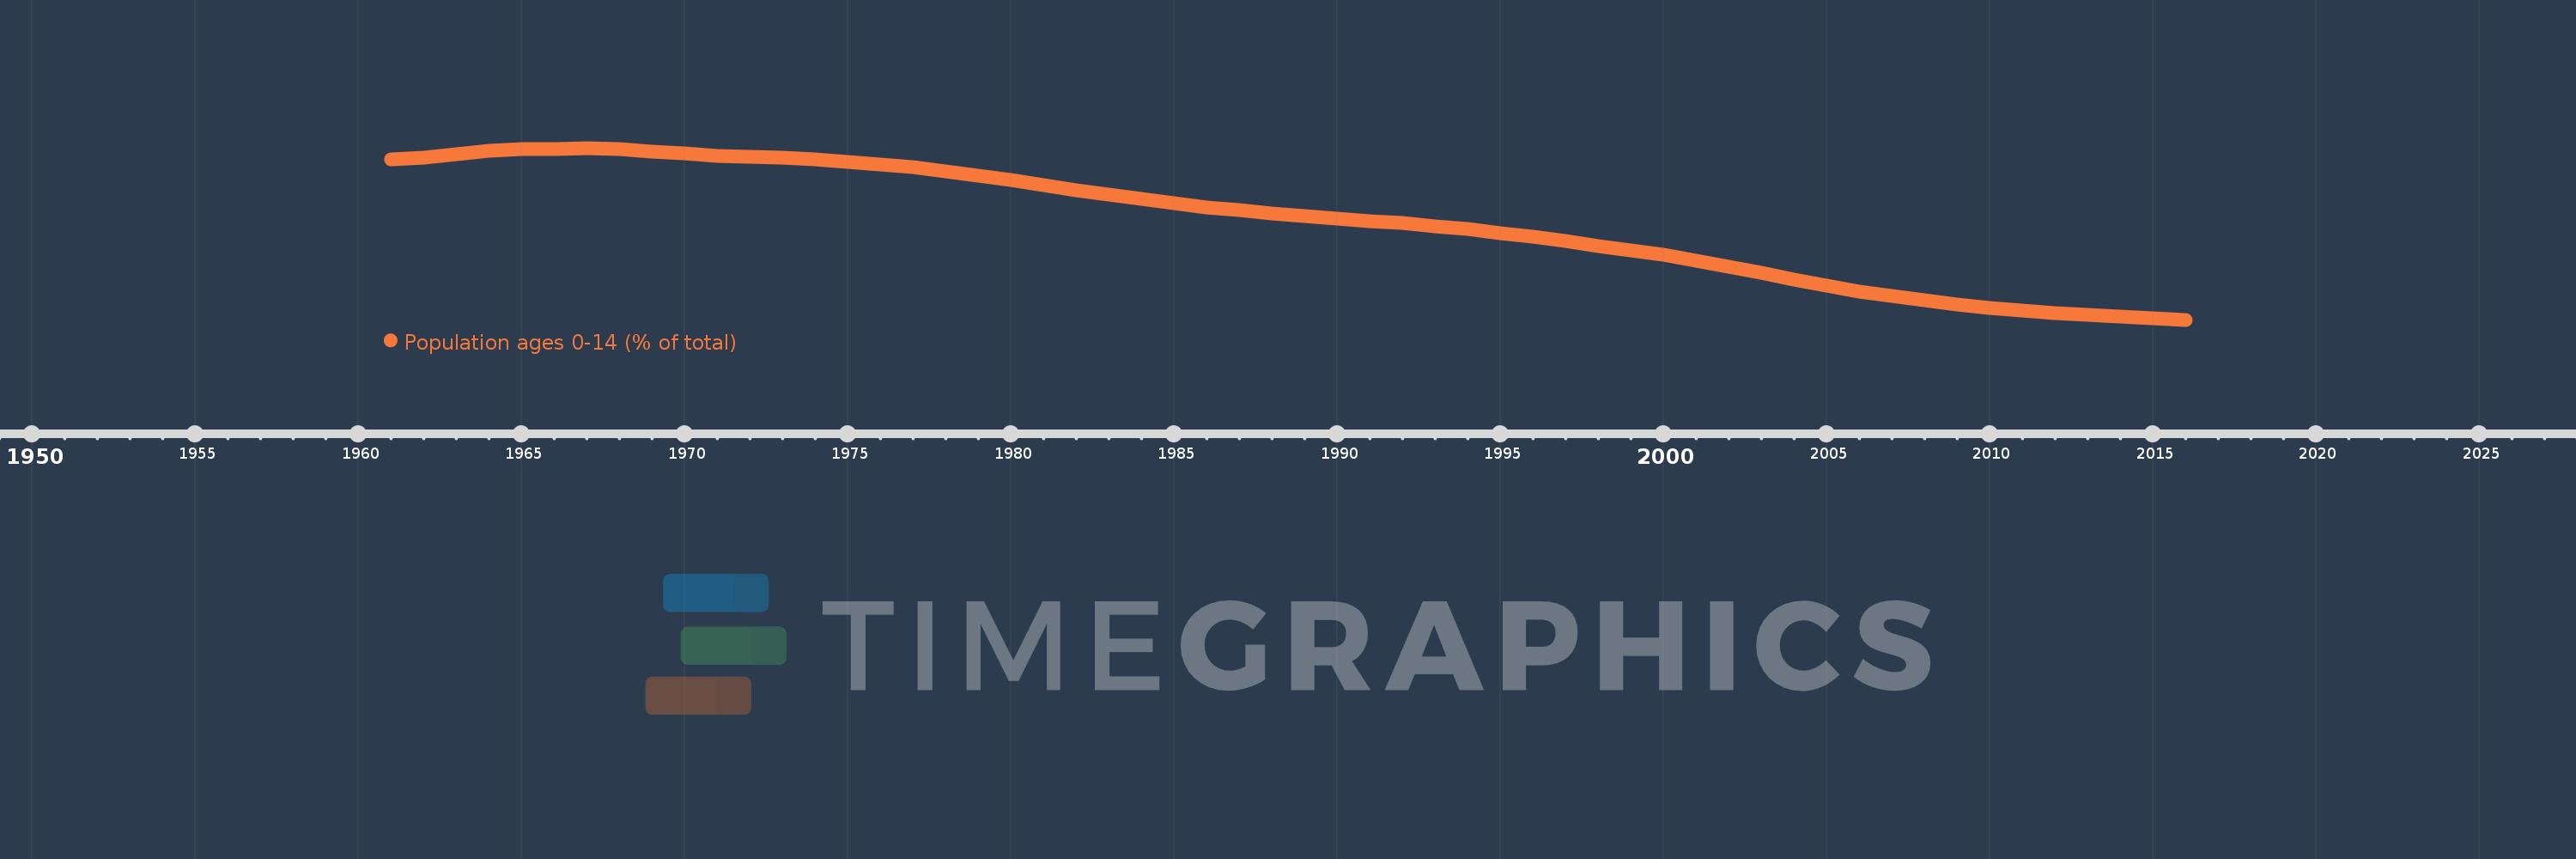
Population ages 0-14 (% of total)
2016,2015,2014,2013,2012,2011,2010,2009,2008,2007,2006,2005,2004,2003,2002,2001,2000,1999,1998,1997,1996,1995,1994,1993,1992,1991,1990,1989,1988,1987,1986,1985,1984,1983,1982,1981,1980,1979,1978,1977,1976,1975,1974,1973,1972,1971,1970,1969,1968,1967,1966,1965,1964,1963,1962,1961
This statistics in other country:
AfghanistanAlbaniaAlgeriaAngolaAntigua and BarbudaArab WorldArgentinaArmeniaArubaAustraliaAustriaAzerbaijanBahamas, TheBahrainBangladeshBarbadosBelarusBelgiumBelizeBeninBhutanBoliviaBosnia and HerzegovinaBotswanaBrazilBrunei DarussalamBulgariaBurkina FasoBurundiCabo VerdeCambodiaCameroonCanadaCaribbean small statesCentral African RepublicCentral Europe and the BalticsChadChannel IslandsChileChinaColombiaComorosCongo, Dem. Rep.Congo, Rep.Costa RicaCote d'IvoireCroatiaCubaCuracaoCyprusCzech RepublicDenmarkDjiboutiDominican RepublicEarly-demographic dividendEast Asia & PacificEast Asia & Pacific (excluding high income)East Asia & Pacific (IDA & IBRD countries)EcuadorEgypt, Arab Rep.El SalvadorEquatorial GuineaEritreaEstoniaEthiopiaEuro areaEurope & Central AsiaEurope & Central Asia (excluding high income)Europe & Central Asia (IDA & IBRD countries)European UnionFijiFinlandFragile and conflict affected situationsFranceFrench PolynesiaGabonGambia, TheGeorgiaGermanyGhanaGreeceGrenadaGuamGuatemalaGuineaGuinea-BissauGuyanaHaitiHeavily indebted poor countries (HIPC)High incomeHondurasHong Kong SAR, ChinaHungaryIBRD onlyIcelandIDA & IBRD totalIDA blendIDA onlyIDA totalIndiaIndonesiaIran, Islamic Rep.IraqIrelandIsraelItalyJamaicaJapanJordanKazakhstanKenyaKiribatiKorea, Dem. People’s Rep.Korea, Rep.KosovoKuwaitKyrgyz RepublicLao PDRLate-demographic dividendLatin America & Caribbean Latin America & Caribbean (excluding high income)Latin America & the Caribbean (IDA & IBRD countries)LatviaLeast developed countries: UN classificationLebanonLesothoLiberiaLibyaLithuaniaLow & middle incomeLow incomeLower middle incomeLuxembourgMacao SAR, ChinaMacedonia, FYRMadagascarMalawiMalaysiaMaldivesMaliMaltaMauritaniaMauritiusMexicoMicronesia, Fed. Sts.Middle East & North AfricaMiddle East & North Africa (excluding high income)Middle East & North Africa (IDA & IBRD countries)Middle incomeMoldovaMongoliaMontenegroMoroccoMozambiqueMyanmarNamibiaNepalNetherlandsNew CaledoniaNew ZealandNicaraguaNigerNigeriaNorth AmericaNorwayOECD membersOmanOther small statesPacific island small statesPakistanPanamaPapua New GuineaParaguayPeruPhilippinesPolandPortugalPost-demographic dividendPre-demographic dividendPuerto RicoQatarRomaniaRussian FederationRwandaSamoaSao Tome and PrincipeSaudi ArabiaSenegalSerbiaSeychellesSierra LeoneSingaporeSlovak RepublicSloveniaSmall statesSolomon IslandsSomaliaSouth AfricaSouth AsiaSouth Asia (IDA & IBRD)South SudanSpainSri LankaSt. LuciaSt. Vincent and the GrenadinesSub-Saharan Africa Sub-Saharan Africa (excluding high income)Sub-Saharan Africa (IDA & IBRD countries)SudanSurinameSwazilandSwedenSwitzerlandSyrian Arab RepublicTajikistanTanzaniaThailandTimor-LesteTogoTongaTrinidad and TobagoTunisiaTurkeyTurkmenistanUgandaUkraineUnited Arab EmiratesUnited KingdomUnited StatesUpper middle incomeUruguayUzbekistanVanuatuVenezuela, RBVietnamVirgin Islands (U.S.)West Bank and GazaWorldYemen, Rep.ZambiaZimbabwe Timeline:
This timeline shows a graph from 1961 to 2016 of IBRD only. No data until 1960. Number of actual observations by date: 56.
Source name:
World Development Indicators
Source organization:
World Bank staff estimates based on age distributions of United Nations Population Division's World Population Prospects.
Categories, topics:
Education, Health
Last updated:
apr 23, 2017
Indicators value changes by year
Minimum:
23.985
jan 1, 2016
Maximum:
40.495
jan 1, 1967
At the date of observation
Value
Absolute change
Change from previous value
jan 1, 1961
39.358
+39.358
0.0%
jan 1, 1962
39.567
+0.208
0.53%
jan 1, 1963
39.878
+0.312
0.79%
jan 1, 1964
40.193
+0.315
0.79%
jan 1, 1965
40.381
+0.188
0.47%
jan 1, 1966
40.402
+0.021
0.05%
jan 1, 1967
40.495
+0.093
0.23%
jan 1, 1968
40.394
-0.101
-0.25%
jan 1, 1969
40.175
-0.219
-0.54%
jan 1, 1970
39.946
-0.229
-0.57%
jan 1, 1971
39.754
-0.192
-0.48%
jan 1, 1972
39.656
-0.098
-0.25%
jan 1, 1973
39.534
-0.122
-0.31%
jan 1, 1974
39.389
-0.146
-0.37%
jan 1, 1975
39.188
-0.201
-0.51%
jan 1, 1976
38.912
-0.276
-0.7%
jan 1, 1977
38.619
-0.293
-0.75%
jan 1, 1978
38.258
-0.361
-0.94%
jan 1, 1979
37.84
-0.418
-1.09%
jan 1, 1980
37.39
-0.451
-1.19%
jan 1, 1981
36.926
-0.463
-1.24%
jan 1, 1982
36.455
-0.472
-1.28%
jan 1, 1983
36.01
-0.445
-1.22%
jan 1, 1984
35.581
-0.429
-1.19%
jan 1, 1985
35.161
-0.42
-1.18%
jan 1, 1986
34.756
-0.405
-1.15%
jan 1, 1987
34.489
-0.267
-0.77%
jan 1, 1988
34.223
-0.266
-0.77%
jan 1, 1989
33.962
-0.261
-0.76%
jan 1, 1990
33.699
-0.263
-0.78%
jan 1, 1991
33.419
-0.281
-0.83%
jan 1, 1992
33.26
-0.159
-0.48%
jan 1, 1993
32.997
-0.263
-0.79%
jan 1, 1994
32.671
-0.326
-0.99%
jan 1, 1995
32.331
-0.339
-1.04%
jan 1, 1996
31.992
-0.339
-1.05%
jan 1, 1997
31.514
-0.478
-1.49%
jan 1, 1998
31.094
-0.42
-1.33%
jan 1, 1999
30.679
-0.416
-1.34%
jan 1, 2000
30.198
-0.481
-1.57%
jan 1, 2001
29.639
-0.558
-1.85%
jan 1, 2002
29.099
-0.54
-1.82%
jan 1, 2003
28.5
-0.599
-2.06%
jan 1, 2004
27.869
-0.631
-2.21%
jan 1, 2005
27.262
-0.608
-2.18%
jan 1, 2006
26.708
-0.554
-2.03%
jan 1, 2007
26.256
-0.452
-1.69%
jan 1, 2008
25.83
-0.426
-1.62%
jan 1, 2009
25.444
-0.385
-1.49%
jan 1, 2010
25.111
-0.333
-1.31%
jan 1, 2011
24.832
-0.279
-1.11%
jan 1, 2012
24.598
-0.233
-0.94%
jan 1, 2013
24.419
-0.18
-0.73%
jan 1, 2014
24.275
-0.144
-0.59%
jan 1, 2015
24.137
-0.138
-0.57%
jan 1, 2016
23.985
-0.152
-0.63%
Ranking of countries by current statistics by years


Comments: