29
/
en
AIzaSyAYiBZKx7MnpbEhh9jyipgxe19OcubqV5w
April 1, 2024
204534
Myanmar
MMR
true
2
1
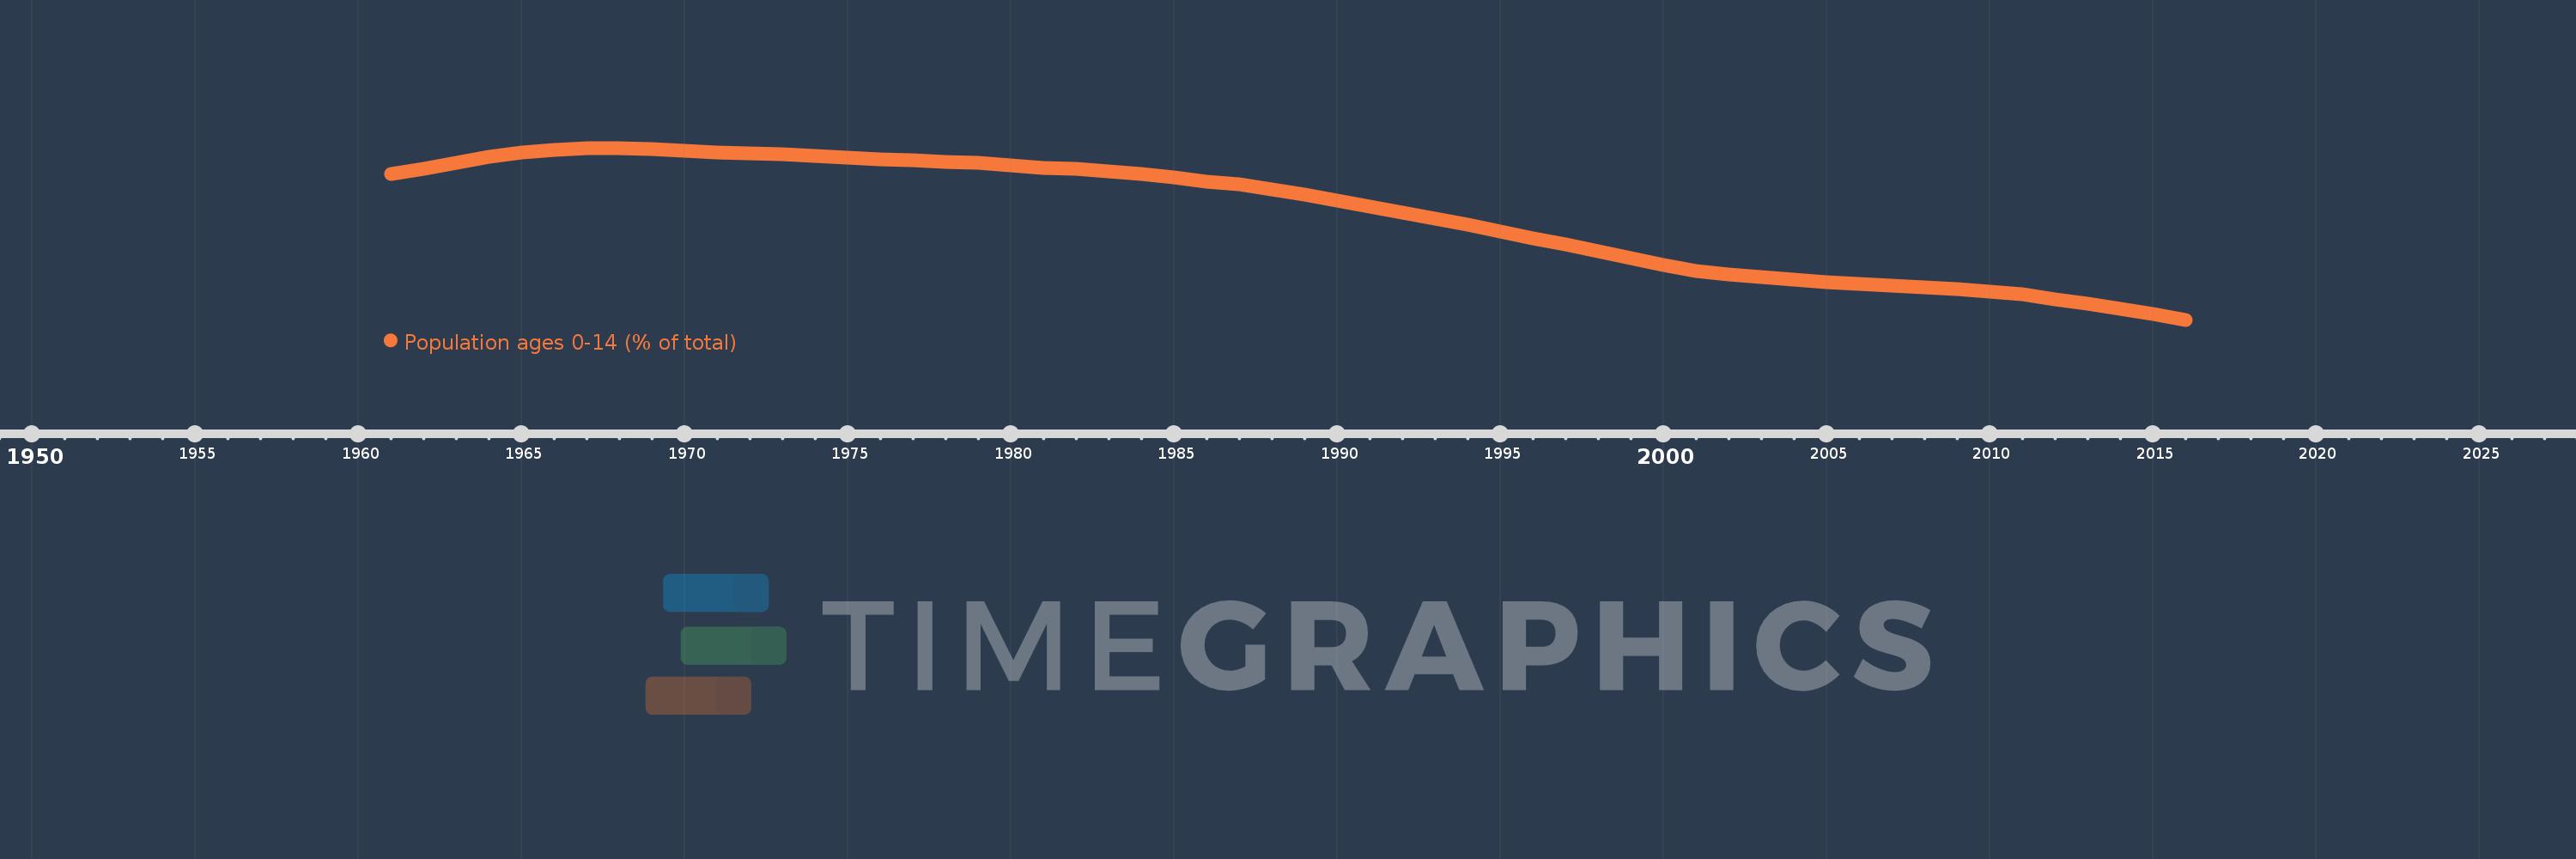
Population ages 0-14 (% of total)
2016,2015,2014,2013,2012,2011,2010,2009,2008,2007,2006,2005,2004,2003,2002,2001,2000,1999,1998,1997,1996,1995,1994,1993,1992,1991,1990,1989,1988,1987,1986,1985,1984,1983,1982,1981,1980,1979,1978,1977,1976,1975,1974,1973,1972,1971,1970,1969,1968,1967,1966,1965,1964,1963,1962,1961
This statistics in other country:
AfghanistanAlbaniaAlgeriaAngolaAntigua and BarbudaArab WorldArgentinaArmeniaArubaAustraliaAustriaAzerbaijanBahamas, TheBahrainBangladeshBarbadosBelarusBelgiumBelizeBeninBhutanBoliviaBosnia and HerzegovinaBotswanaBrazilBrunei DarussalamBulgariaBurkina FasoBurundiCabo VerdeCambodiaCameroonCanadaCaribbean small statesCentral African RepublicCentral Europe and the BalticsChadChannel IslandsChileChinaColombiaComorosCongo, Dem. Rep.Congo, Rep.Costa RicaCote d'IvoireCroatiaCubaCuracaoCyprusCzech RepublicDenmarkDjiboutiDominican RepublicEarly-demographic dividendEast Asia & PacificEast Asia & Pacific (excluding high income)East Asia & Pacific (IDA & IBRD countries)EcuadorEgypt, Arab Rep.El SalvadorEquatorial GuineaEritreaEstoniaEthiopiaEuro areaEurope & Central AsiaEurope & Central Asia (excluding high income)Europe & Central Asia (IDA & IBRD countries)European UnionFijiFinlandFragile and conflict affected situationsFranceFrench PolynesiaGabonGambia, TheGeorgiaGermanyGhanaGreeceGrenadaGuamGuatemalaGuineaGuinea-BissauGuyanaHaitiHeavily indebted poor countries (HIPC)High incomeHondurasHong Kong SAR, ChinaHungaryIBRD onlyIcelandIDA & IBRD totalIDA blendIDA onlyIDA totalIndiaIndonesiaIran, Islamic Rep.IraqIrelandIsraelItalyJamaicaJapanJordanKazakhstanKenyaKiribatiKorea, Dem. People’s Rep.Korea, Rep.KosovoKuwaitKyrgyz RepublicLao PDRLate-demographic dividendLatin America & Caribbean Latin America & Caribbean (excluding high income)Latin America & the Caribbean (IDA & IBRD countries)LatviaLeast developed countries: UN classificationLebanonLesothoLiberiaLibyaLithuaniaLow & middle incomeLow incomeLower middle incomeLuxembourgMacao SAR, ChinaMacedonia, FYRMadagascarMalawiMalaysiaMaldivesMaliMaltaMauritaniaMauritiusMexicoMicronesia, Fed. Sts.Middle East & North AfricaMiddle East & North Africa (excluding high income)Middle East & North Africa (IDA & IBRD countries)Middle incomeMoldovaMongoliaMontenegroMoroccoMozambiqueMyanmarNamibiaNepalNetherlandsNew CaledoniaNew ZealandNicaraguaNigerNigeriaNorth AmericaNorwayOECD membersOmanOther small statesPacific island small statesPakistanPanamaPapua New GuineaParaguayPeruPhilippinesPolandPortugalPost-demographic dividendPre-demographic dividendPuerto RicoQatarRomaniaRussian FederationRwandaSamoaSao Tome and PrincipeSaudi ArabiaSenegalSerbiaSeychellesSierra LeoneSingaporeSlovak RepublicSloveniaSmall statesSolomon IslandsSomaliaSouth AfricaSouth AsiaSouth Asia (IDA & IBRD)South SudanSpainSri LankaSt. LuciaSt. Vincent and the GrenadinesSub-Saharan Africa Sub-Saharan Africa (excluding high income)Sub-Saharan Africa (IDA & IBRD countries)SudanSurinameSwazilandSwedenSwitzerlandSyrian Arab RepublicTajikistanTanzaniaThailandTimor-LesteTogoTongaTrinidad and TobagoTunisiaTurkeyTurkmenistanUgandaUkraineUnited Arab EmiratesUnited KingdomUnited StatesUpper middle incomeUruguayUzbekistanVanuatuVenezuela, RBVietnamVirgin Islands (U.S.)West Bank and GazaWorldYemen, Rep.ZambiaZimbabwe Timeline:
This timeline shows a graph from 1961 to 2016 of Myanmar. No data until 1960. Number of actual observations by date: 56.
Source name:
World Development Indicators
Source organization:
World Bank staff estimates based on age distributions of United Nations Population Division's World Population Prospects.
Categories, topics:
Education, Health
Last updated:
apr 23, 2017
Indicators value changes by year
Minimum:
27.551
jan 1, 2016
Maximum:
42.846
jan 1, 1968
At the date of observation
Value
Absolute change
Change from previous value
jan 1, 1961
40.515
+40.515
0.0%
jan 1, 1962
40.989
+0.474
1.17%
jan 1, 1963
41.542
+0.553
1.35%
jan 1, 1964
42.078
+0.535
1.29%
jan 1, 1965
42.458
+0.381
0.9%
jan 1, 1966
42.636
+0.178
0.42%
jan 1, 1967
42.831
+0.195
0.46%
jan 1, 1968
42.846
+0.014
0.03%
jan 1, 1969
42.733
-0.112
-0.26%
jan 1, 1970
42.575
-0.158
-0.37%
jan 1, 1971
42.41
-0.165
-0.39%
jan 1, 1972
42.382
-0.028
-0.07%
jan 1, 1973
42.287
-0.095
-0.22%
jan 1, 1974
42.153
-0.134
-0.32%
jan 1, 1975
42.002
-0.152
-0.36%
jan 1, 1976
41.841
-0.161
-0.38%
jan 1, 1977
41.735
-0.107
-0.25%
jan 1, 1978
41.62
-0.115
-0.27%
jan 1, 1979
41.486
-0.134
-0.32%
jan 1, 1980
41.313
-0.172
-0.42%
jan 1, 1981
41.097
-0.217
-0.52%
jan 1, 1982
40.956
-0.141
-0.34%
jan 1, 1983
40.766
-0.19
-0.46%
jan 1, 1984
40.527
-0.239
-0.59%
jan 1, 1985
40.23
-0.297
-0.73%
jan 1, 1986
39.866
-0.364
-0.91%
jan 1, 1987
39.582
-0.284
-0.71%
jan 1, 1988
39.18
-0.402
-1.01%
jan 1, 1989
38.696
-0.485
-1.24%
jan 1, 1990
38.172
-0.524
-1.35%
jan 1, 1991
37.628
-0.544
-1.43%
jan 1, 1992
37.067
-0.561
-1.49%
jan 1, 1993
36.536
-0.531
-1.43%
jan 1, 1994
36.005
-0.532
-1.45%
jan 1, 1995
35.435
-0.57
-1.58%
jan 1, 1996
34.82
-0.615
-1.74%
jan 1, 1997
34.226
-0.594
-1.71%
jan 1, 1998
33.611
-0.616
-1.8%
jan 1, 1999
32.997
-0.614
-1.83%
jan 1, 2000
32.425
-0.572
-1.73%
jan 1, 2001
31.916
-0.509
-1.57%
jan 1, 2002
31.597
-0.318
-1.0%
jan 1, 2003
31.33
-0.268
-0.85%
jan 1, 2004
31.107
-0.222
-0.71%
jan 1, 2005
30.91
-0.197
-0.63%
jan 1, 2006
30.716
-0.194
-0.63%
jan 1, 2007
30.598
-0.118
-0.39%
jan 1, 2008
30.439
-0.159
-0.52%
jan 1, 2009
30.244
-0.195
-0.64%
jan 1, 2010
30.025
-0.219
-0.72%
jan 1, 2011
29.787
-0.238
-0.79%
jan 1, 2012
29.372
-0.415
-1.39%
jan 1, 2013
28.958
-0.414
-1.41%
jan 1, 2014
28.526
-0.432
-1.49%
jan 1, 2015
28.057
-0.469
-1.64%
jan 1, 2016
27.551
-0.507
-1.81%
Ranking of countries by current statistics by years


Comments: