29
/
en
AIzaSyAYiBZKx7MnpbEhh9jyipgxe19OcubqV5w
April 1, 2024
96760
Burundi
BDI
true
2
1
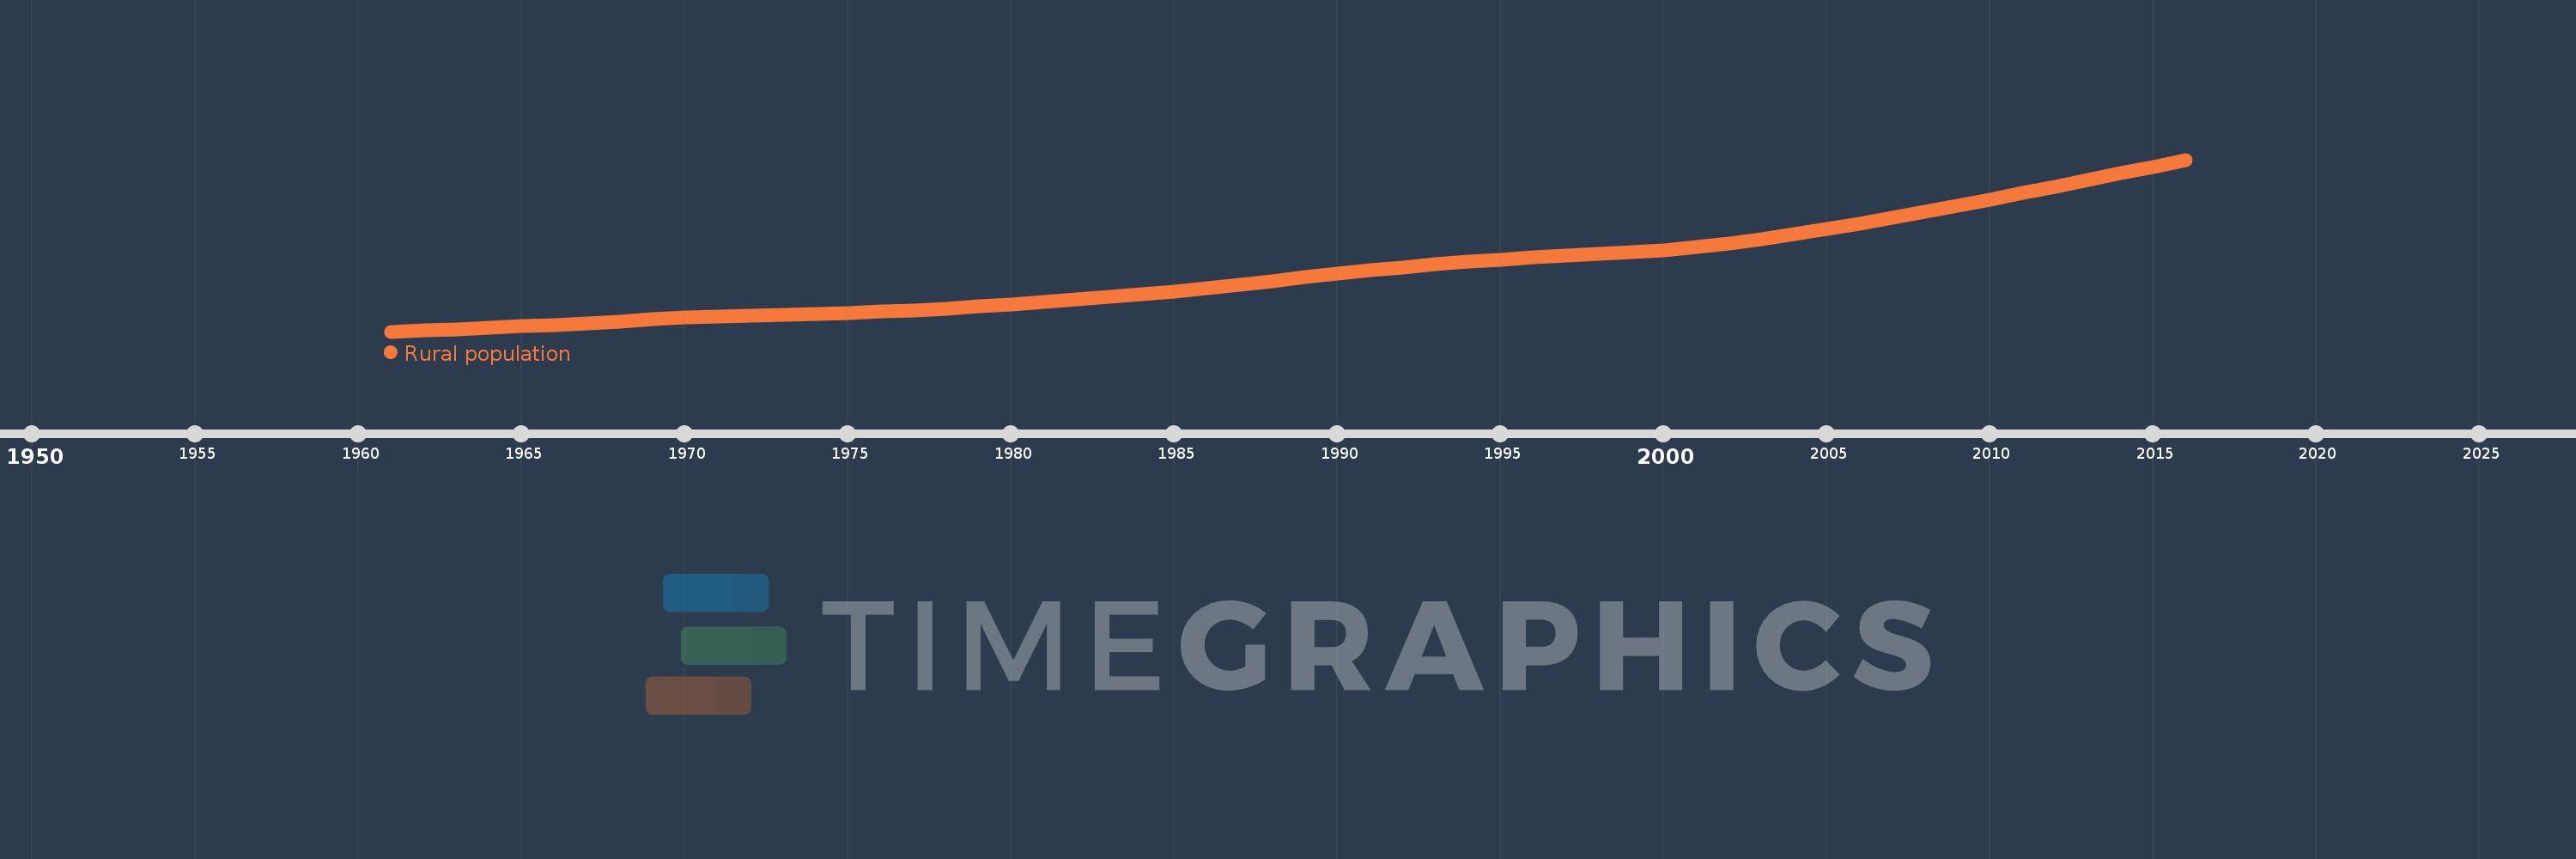
Rural population
2016,2015,2014,2013,2012,2011,2010,2009,2008,2007,2006,2005,2004,2003,2002,2001,2000,1999,1998,1997,1996,1995,1994,1993,1992,1991,1990,1989,1988,1987,1986,1985,1984,1983,1982,1981,1980,1979,1978,1977,1976,1975,1974,1973,1972,1971,1970,1969,1968,1967,1966,1965,1964,1963,1962,1961
This statistics in other country:
AfghanistanAlbaniaAlgeriaAmerican SamoaAndorraAngolaAntigua and BarbudaArab WorldArgentinaArmeniaArubaAustraliaAustriaAzerbaijanBahamas, TheBahrainBangladeshBarbadosBelarusBelgiumBelizeBeninBermudaBhutanBoliviaBosnia and HerzegovinaBotswanaBrazilBritish Virgin IslandsBrunei DarussalamBulgariaBurkina FasoBurundiCabo VerdeCambodiaCameroonCanadaCaribbean small statesCayman IslandsCentral African RepublicCentral Europe and the BalticsChadChannel IslandsChileChinaColombiaComorosCongo, Dem. Rep.Congo, Rep.Costa RicaCote d'IvoireCroatiaCubaCuracaoCyprusCzech RepublicDenmarkDjiboutiDominicaDominican RepublicEarly-demographic dividendEast Asia & PacificEast Asia & Pacific (excluding high income)East Asia & Pacific (IDA & IBRD countries)EcuadorEgypt, Arab Rep.El SalvadorEquatorial GuineaEritreaEstoniaEthiopiaEuro areaEurope & Central AsiaEurope & Central Asia (excluding high income)Europe & Central Asia (IDA & IBRD countries)European UnionFaroe IslandsFijiFinlandFragile and conflict affected situationsFranceFrench PolynesiaGabonGambia, TheGeorgiaGermanyGhanaGibraltarGreeceGreenlandGrenadaGuamGuatemalaGuineaGuinea-BissauGuyanaHaitiHeavily indebted poor countries (HIPC)High incomeHondurasHong Kong SAR, ChinaHungaryIBRD onlyIcelandIDA & IBRD totalIDA blendIDA onlyIDA totalIndiaIndonesiaIran, Islamic Rep.IraqIrelandIsle of ManIsraelItalyJamaicaJapanJordanKazakhstanKenyaKiribatiKorea, Dem. People’s Rep.Korea, Rep.KuwaitKyrgyz RepublicLao PDRLate-demographic dividendLatin America & Caribbean Latin America & Caribbean (excluding high income)Latin America & the Caribbean (IDA & IBRD countries)LatviaLeast developed countries: UN classificationLebanonLesothoLiberiaLibyaLiechtensteinLithuaniaLow & middle incomeLow incomeLower middle incomeLuxembourgMacao SAR, ChinaMacedonia, FYRMadagascarMalawiMalaysiaMaldivesMaliMaltaMarshall IslandsMauritaniaMauritiusMexicoMicronesia, Fed. Sts.Middle East & North AfricaMiddle East & North Africa (excluding high income)Middle East & North Africa (IDA & IBRD countries)Middle incomeMoldovaMonacoMongoliaMontenegroMoroccoMozambiqueMyanmarNamibiaNauruNepalNetherlandsNew CaledoniaNew ZealandNicaraguaNigerNigeriaNorth AmericaNorthern Mariana IslandsNorwayOECD membersOmanOther small statesPacific island small statesPakistanPalauPanamaPapua New GuineaParaguayPeruPhilippinesPolandPortugalPost-demographic dividendPre-demographic dividendPuerto RicoQatarRomaniaRussian FederationRwandaSamoaSan MarinoSao Tome and PrincipeSaudi ArabiaSenegalSerbiaSeychellesSierra LeoneSingaporeSint Maarten (Dutch part)Slovak RepublicSloveniaSmall statesSolomon IslandsSomaliaSouth AfricaSouth AsiaSouth Asia (IDA & IBRD)South SudanSpainSri LankaSt. Kitts and NevisSt. LuciaSt. Vincent and the GrenadinesSub-Saharan Africa Sub-Saharan Africa (excluding high income)Sub-Saharan Africa (IDA & IBRD countries)SudanSurinameSwazilandSwedenSwitzerlandSyrian Arab RepublicTajikistanTanzaniaThailandTimor-LesteTogoTongaTrinidad and TobagoTunisiaTurkeyTurkmenistanTurks and Caicos IslandsTuvaluUgandaUkraineUnited Arab EmiratesUnited KingdomUnited StatesUpper middle incomeUruguayUzbekistanVanuatuVenezuela, RBVietnamVirgin Islands (U.S.)West Bank and GazaWorldYemen, Rep.ZambiaZimbabwe Timeline:
This timeline shows a graph from 1961 to 2016 of Burundi. No data until 1960. Number of actual observations by date: 56.
Source name:
World Development Indicators
Source organization:
The data on urban population shares used to estimate rural population come from the United Nations, World Urbanization Prospects. Total population figures are World Bank estimates.
Categories, topics:
Agriculture & Rural Development
Last updated:
apr 23, 2017
Indicators value changes by year
Minimum:
2.729 mln
jan 1, 1961
Maximum:
9.831 mln
jan 1, 2016
At the date of observation
Value
Absolute change
Change from previous value
jan 1, 1961
2.729 mln
+2.729 mln
0.0%
jan 1, 1962
2.78 mln
+51.442K
1.89%
jan 1, 1963
2.832 mln
+51.861K
1.87%
jan 1, 1964
2.886 mln
+54.028K
1.91%
jan 1, 1965
2.945 mln
+58.51K
2.03%
jan 1, 1966
3.008 mln
+63.701K
2.16%
jan 1, 1967
3.078 mln
+69.943K
2.32%
jan 1, 1968
3.154 mln
+75.871K
2.46%
jan 1, 1969
3.231 mln
+76.485K
2.42%
jan 1, 1970
3.3 mln
+69.757K
2.16%
jan 1, 1971
3.359 mln
+58.301K
1.77%
jan 1, 1972
3.403 mln
+44.659K
1.33%
jan 1, 1973
3.437 mln
+33.915K
1.0%
jan 1, 1974
3.467 mln
+29.676K
0.86%
jan 1, 1975
3.501 mln
+34.467K
0.99%
jan 1, 1976
3.547 mln
+45.902K
1.31%
jan 1, 1977
3.607 mln
+59.589K
1.68%
jan 1, 1978
3.679 mln
+71.696K
1.99%
jan 1, 1979
3.761 mln
+82.293K
2.24%
jan 1, 1980
3.851 mln
+90.061K
2.39%
jan 1, 1981
3.947 mln
+96.477K
2.51%
jan 1, 1982
4.049 mln
+101.268K
2.57%
jan 1, 1983
4.155 mln
+106.616K
2.63%
jan 1, 1984
4.269 mln
+113.635K
2.73%
jan 1, 1985
4.392 mln
+122.848K
2.88%
jan 1, 1986
4.525 mln
+133.134K
3.03%
jan 1, 1987
4.669 mln
+144.029K
3.18%
jan 1, 1988
4.821 mln
+152.456K
3.27%
jan 1, 1989
4.976 mln
+154.627K
3.21%
jan 1, 1990
5.125 mln
+148.537K
2.99%
jan 1, 1991
5.261 mln
+136.498K
2.66%
jan 1, 1992
5.388 mln
+126.517K
2.4%
jan 1, 1993
5.504 mln
+116.213K
2.16%
jan 1, 1994
5.609 mln
+105.292K
1.91%
jan 1, 1995
5.704 mln
+94.636K
1.69%
jan 1, 1996
5.789 mln
+85.335K
1.5%
jan 1, 1997
5.864 mln
+74.848K
1.29%
jan 1, 1998
5.931 mln
+67.309K
1.15%
jan 1, 1999
6.002 mln
+70.746K
1.19%
jan 1, 2000
6.091 mln
+89.389K
1.49%
jan 1, 2001
6.209 mln
+117.634K
1.93%
jan 1, 2002
6.359 mln
+149.898K
2.41%
jan 1, 2003
6.538 mln
+179.336K
2.82%
jan 1, 2004
6.742 mln
+203.621K
3.11%
jan 1, 2005
6.961 mln
+219.503K
3.26%
jan 1, 2006
7.19 mln
+228.963K
3.29%
jan 1, 2007
7.428 mln
+237.357K
3.3%
jan 1, 2008
7.675 mln
+246.962K
3.32%
jan 1, 2009
7.929 mln
+254.506K
3.32%
jan 1, 2010
8.19 mln
+260.443K
3.28%
jan 1, 2011
8.454 mln
+264.711K
3.23%
jan 1, 2012
8.722 mln
+267.49K
3.16%
jan 1, 2013
8.992 mln
+269.884K
3.09%
jan 1, 2014
9.265 mln
+273.57K
3.04%
jan 1, 2015
9.545 mln
+279.385K
3.02%
jan 1, 2016
9.831 mln
+286.389K
3.0%
Ranking of countries by current statistics by years


Comments: