29
/
en
AIzaSyAYiBZKx7MnpbEhh9jyipgxe19OcubqV5w
April 1, 2024
199823
Mongolia
MNG
true
2
1
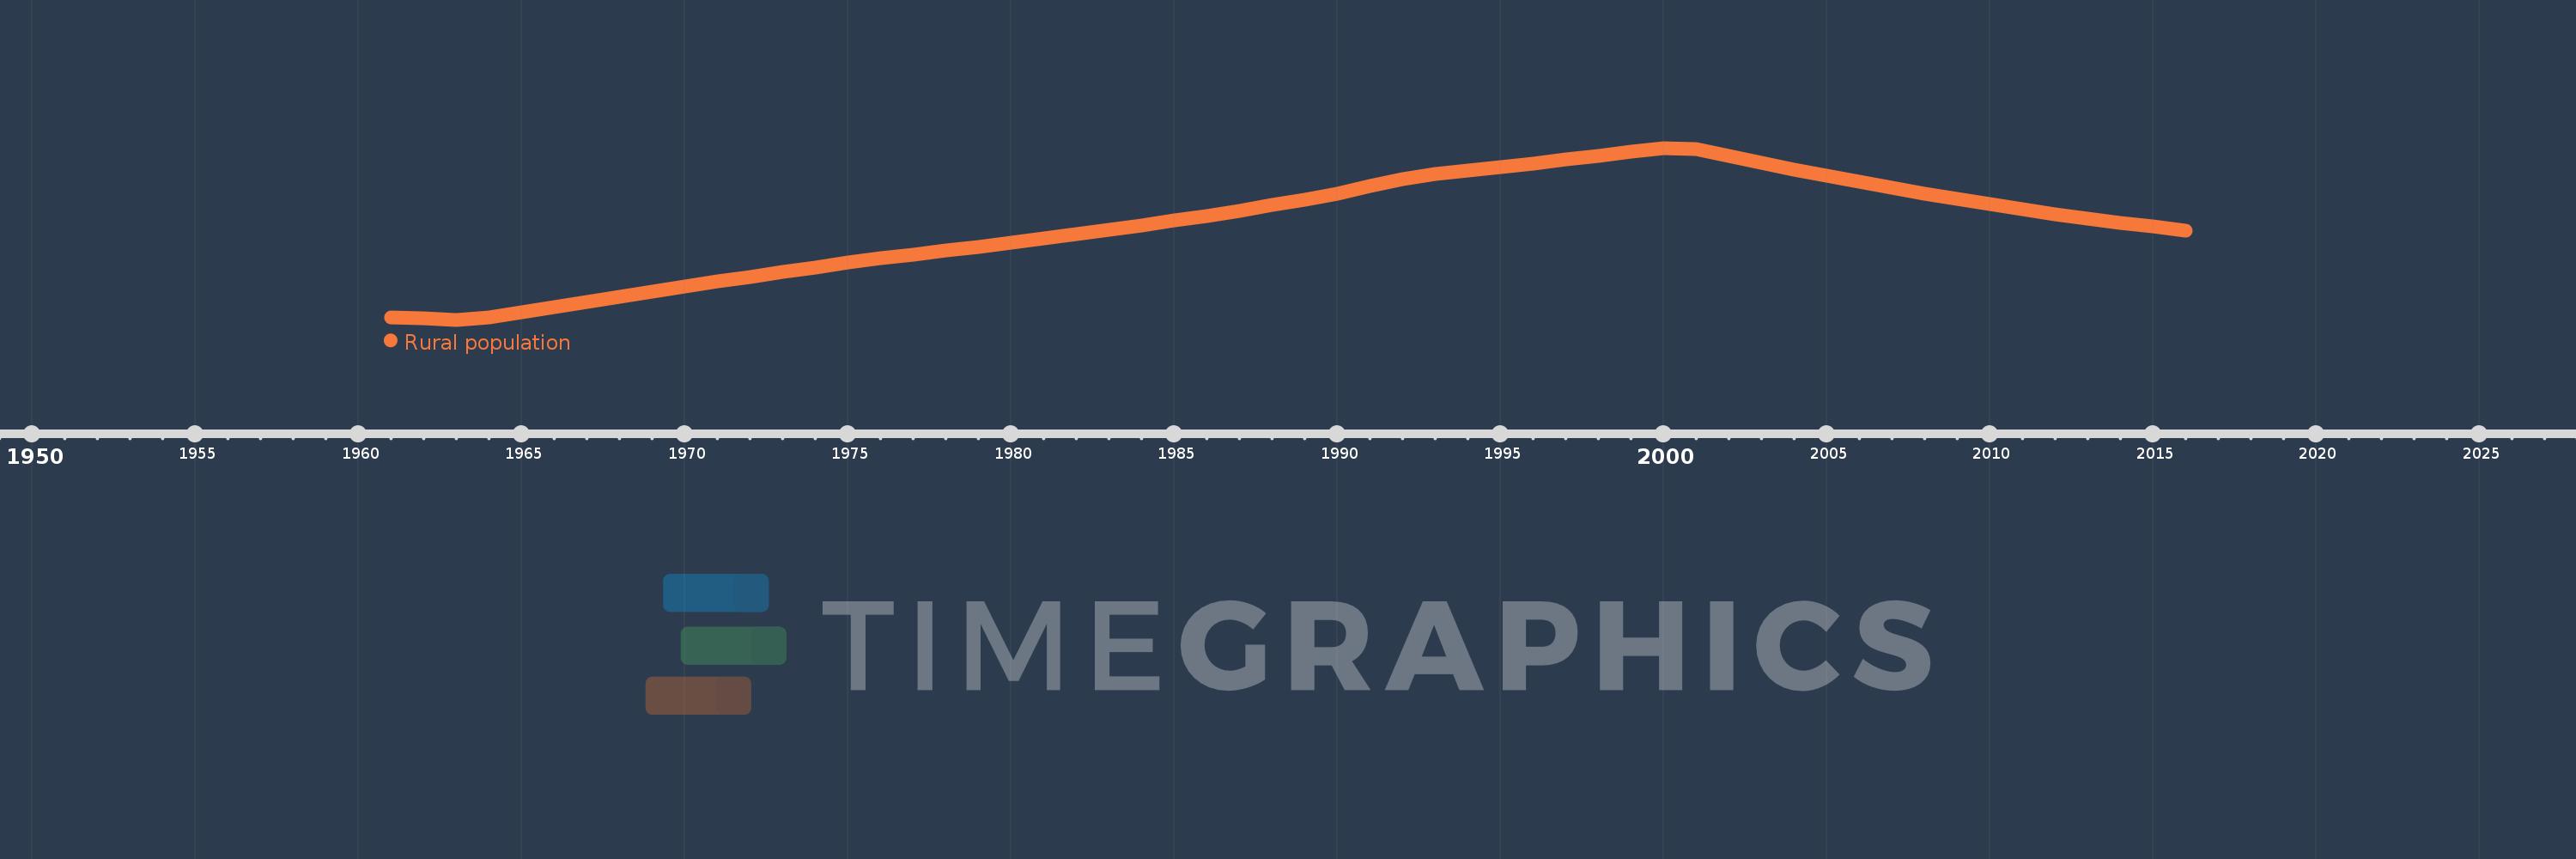
Rural population
2016,2015,2014,2013,2012,2011,2010,2009,2008,2007,2006,2005,2004,2003,2002,2001,2000,1999,1998,1997,1996,1995,1994,1993,1992,1991,1990,1989,1988,1987,1986,1985,1984,1983,1982,1981,1980,1979,1978,1977,1976,1975,1974,1973,1972,1971,1970,1969,1968,1967,1966,1965,1964,1963,1962,1961
This statistics in other country:
AfghanistanAlbaniaAlgeriaAmerican SamoaAndorraAngolaAntigua and BarbudaArab WorldArgentinaArmeniaArubaAustraliaAustriaAzerbaijanBahamas, TheBahrainBangladeshBarbadosBelarusBelgiumBelizeBeninBermudaBhutanBoliviaBosnia and HerzegovinaBotswanaBrazilBritish Virgin IslandsBrunei DarussalamBulgariaBurkina FasoBurundiCabo VerdeCambodiaCameroonCanadaCaribbean small statesCayman IslandsCentral African RepublicCentral Europe and the BalticsChadChannel IslandsChileChinaColombiaComorosCongo, Dem. Rep.Congo, Rep.Costa RicaCote d'IvoireCroatiaCubaCuracaoCyprusCzech RepublicDenmarkDjiboutiDominicaDominican RepublicEarly-demographic dividendEast Asia & PacificEast Asia & Pacific (excluding high income)East Asia & Pacific (IDA & IBRD countries)EcuadorEgypt, Arab Rep.El SalvadorEquatorial GuineaEritreaEstoniaEthiopiaEuro areaEurope & Central AsiaEurope & Central Asia (excluding high income)Europe & Central Asia (IDA & IBRD countries)European UnionFaroe IslandsFijiFinlandFragile and conflict affected situationsFranceFrench PolynesiaGabonGambia, TheGeorgiaGermanyGhanaGibraltarGreeceGreenlandGrenadaGuamGuatemalaGuineaGuinea-BissauGuyanaHaitiHeavily indebted poor countries (HIPC)High incomeHondurasHong Kong SAR, ChinaHungaryIBRD onlyIcelandIDA & IBRD totalIDA blendIDA onlyIDA totalIndiaIndonesiaIran, Islamic Rep.IraqIrelandIsle of ManIsraelItalyJamaicaJapanJordanKazakhstanKenyaKiribatiKorea, Dem. People’s Rep.Korea, Rep.KuwaitKyrgyz RepublicLao PDRLate-demographic dividendLatin America & Caribbean Latin America & Caribbean (excluding high income)Latin America & the Caribbean (IDA & IBRD countries)LatviaLeast developed countries: UN classificationLebanonLesothoLiberiaLibyaLiechtensteinLithuaniaLow & middle incomeLow incomeLower middle incomeLuxembourgMacao SAR, ChinaMacedonia, FYRMadagascarMalawiMalaysiaMaldivesMaliMaltaMarshall IslandsMauritaniaMauritiusMexicoMicronesia, Fed. Sts.Middle East & North AfricaMiddle East & North Africa (excluding high income)Middle East & North Africa (IDA & IBRD countries)Middle incomeMoldovaMonacoMongoliaMontenegroMoroccoMozambiqueMyanmarNamibiaNauruNepalNetherlandsNew CaledoniaNew ZealandNicaraguaNigerNigeriaNorth AmericaNorthern Mariana IslandsNorwayOECD membersOmanOther small statesPacific island small statesPakistanPalauPanamaPapua New GuineaParaguayPeruPhilippinesPolandPortugalPost-demographic dividendPre-demographic dividendPuerto RicoQatarRomaniaRussian FederationRwandaSamoaSan MarinoSao Tome and PrincipeSaudi ArabiaSenegalSerbiaSeychellesSierra LeoneSingaporeSint Maarten (Dutch part)Slovak RepublicSloveniaSmall statesSolomon IslandsSomaliaSouth AfricaSouth AsiaSouth Asia (IDA & IBRD)South SudanSpainSri LankaSt. Kitts and NevisSt. LuciaSt. Vincent and the GrenadinesSub-Saharan Africa Sub-Saharan Africa (excluding high income)Sub-Saharan Africa (IDA & IBRD countries)SudanSurinameSwazilandSwedenSwitzerlandSyrian Arab RepublicTajikistanTanzaniaThailandTimor-LesteTogoTongaTrinidad and TobagoTunisiaTurkeyTurkmenistanTurks and Caicos IslandsTuvaluUgandaUkraineUnited Arab EmiratesUnited KingdomUnited StatesUpper middle incomeUruguayUzbekistanVanuatuVenezuela, RBVietnamVirgin Islands (U.S.)West Bank and GazaWorldYemen, Rep.ZambiaZimbabwe Timeline:
This timeline shows a graph from 1961 to 2016 of Mongolia. No data until 1960. Number of actual observations by date: 56.
Source name:
World Development Indicators
Source organization:
The data on urban population shares used to estimate rural population come from the United Nations, World Urbanization Prospects. Total population figures are World Bank estimates.
Categories, topics:
Agriculture & Rural Development
Last updated:
apr 23, 2017
Indicators value changes by year
Minimum:
609.527K
jan 1, 1963
Maximum:
1.031 mln
jan 1, 2000
At the date of observation
Value
Absolute change
Change from previous value
jan 1, 1961
614.596K
+614.596K
0.0%
jan 1, 1962
612.075K
-2.521K
-0.41%
jan 1, 1963
609.527K
-2.548K
-0.42%
jan 1, 1964
614.422K
+4.895K
0.8%
jan 1, 1965
627.679K
+13.257K
2.16%
jan 1, 1966
640.87K
+13.191K
2.1%
jan 1, 1967
653.801K
+12.931K
2.02%
jan 1, 1968
666.593K
+12.792K
1.96%
jan 1, 1969
679.397K
+12.804K
1.92%
jan 1, 1970
691.465K
+12.068K
1.78%
jan 1, 1971
702.689K
+11.224K
1.62%
jan 1, 1972
714.236K
+11.547K
1.64%
jan 1, 1973
725.94K
+11.704K
1.64%
jan 1, 1974
737.623K
+11.683K
1.61%
jan 1, 1975
748.944K
+11.321K
1.53%
jan 1, 1976
759.711K
+10.767K
1.44%
jan 1, 1977
769.847K
+10.136K
1.33%
jan 1, 1978
779.497K
+9.65K
1.25%
jan 1, 1979
788.69K
+9.193K
1.18%
jan 1, 1980
798.649K
+9.959K
1.26%
jan 1, 1981
809.616K
+10.967K
1.37%
jan 1, 1982
820.352K
+10.736K
1.33%
jan 1, 1983
830.767K
+10.415K
1.27%
jan 1, 1984
841.231K
+10.464K
1.26%
jan 1, 1985
852.243K
+11.012K
1.31%
jan 1, 1986
864.079K
+11.836K
1.39%
jan 1, 1987
876.929K
+12.85K
1.49%
jan 1, 1988
890.3K
+13.371K
1.52%
jan 1, 1989
902.757K
+12.457K
1.4%
jan 1, 1990
918.963K
+16.206K
1.8%
jan 1, 1991
938.462K
+19.499K
2.12%
jan 1, 1992
953.994K
+15.532K
1.66%
jan 1, 1993
966.009K
+12.015K
1.26%
jan 1, 1994
975.531K
+9.522K
0.99%
jan 1, 1995
984.011K
+8.48K
0.87%
jan 1, 1996
992.638K
+8.627K
0.88%
jan 1, 1997
1.002 mln
+9.047K
0.91%
jan 1, 1998
1.011 mln
+9.344K
0.93%
jan 1, 1999
1.021 mln
+9.671K
0.96%
jan 1, 2000
1.031 mln
+10.009K
0.98%
jan 1, 2001
1.028 mln
-2.999K
-0.29%
jan 1, 2002
1.011 mln
-16.796K
-1.63%
jan 1, 2003
994.408K
-16.506K
-1.63%
jan 1, 2004
978.285K
-16.123K
-1.62%
jan 1, 2005
962.622K
-15.663K
-1.6%
jan 1, 2006
947.569K
-15.053K
-1.56%
jan 1, 2007
932.951K
-14.618K
-1.54%
jan 1, 2008
918.776K
-14.175K
-1.52%
jan 1, 2009
905.105K
-13.671K
-1.49%
jan 1, 2010
892.171K
-12.934K
-1.43%
jan 1, 2011
879.796K
-12.375K
-1.39%
jan 1, 2012
868.06K
-11.736K
-1.33%
jan 1, 2013
857.33K
-10.73K
-1.24%
jan 1, 2014
847.288K
-10.042K
-1.17%
jan 1, 2015
837.403K
-9.885K
-1.17%
jan 1, 2016
827.374K
-10.029K
-1.2%
Ranking of countries by current statistics by years


Comments: