29
/
en
AIzaSyAYiBZKx7MnpbEhh9jyipgxe19OcubqV5w
April 1, 2024
194897
Mauritius
MUS
true
2
1
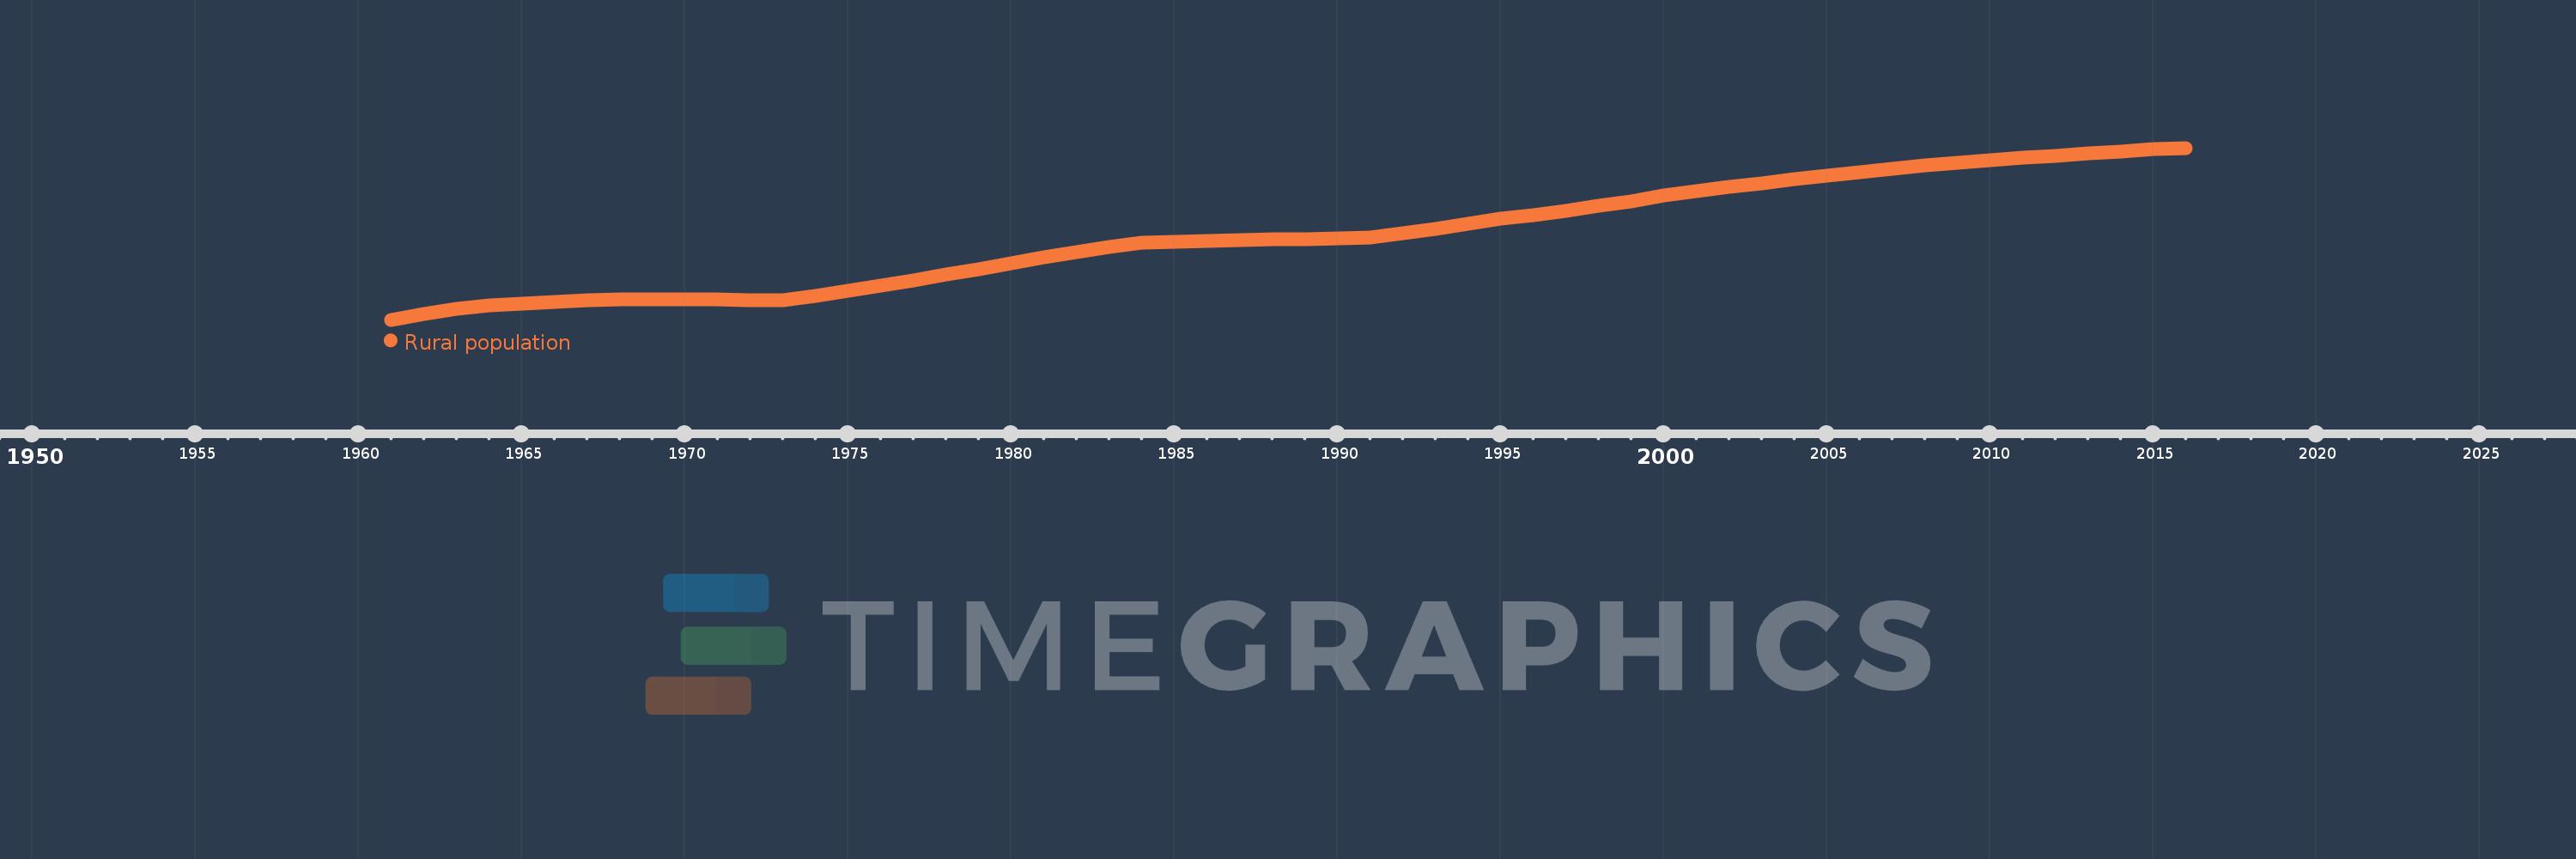
Rural population
2016,2015,2014,2013,2012,2011,2010,2009,2008,2007,2006,2005,2004,2003,2002,2001,2000,1999,1998,1997,1996,1995,1994,1993,1992,1991,1990,1989,1988,1987,1986,1985,1984,1983,1982,1981,1980,1979,1978,1977,1976,1975,1974,1973,1972,1971,1970,1969,1968,1967,1966,1965,1964,1963,1962,1961
This statistics in other country:
AfghanistanAlbaniaAlgeriaAmerican SamoaAndorraAngolaAntigua and BarbudaArab WorldArgentinaArmeniaArubaAustraliaAustriaAzerbaijanBahamas, TheBahrainBangladeshBarbadosBelarusBelgiumBelizeBeninBermudaBhutanBoliviaBosnia and HerzegovinaBotswanaBrazilBritish Virgin IslandsBrunei DarussalamBulgariaBurkina FasoBurundiCabo VerdeCambodiaCameroonCanadaCaribbean small statesCayman IslandsCentral African RepublicCentral Europe and the BalticsChadChannel IslandsChileChinaColombiaComorosCongo, Dem. Rep.Congo, Rep.Costa RicaCote d'IvoireCroatiaCubaCuracaoCyprusCzech RepublicDenmarkDjiboutiDominicaDominican RepublicEarly-demographic dividendEast Asia & PacificEast Asia & Pacific (excluding high income)East Asia & Pacific (IDA & IBRD countries)EcuadorEgypt, Arab Rep.El SalvadorEquatorial GuineaEritreaEstoniaEthiopiaEuro areaEurope & Central AsiaEurope & Central Asia (excluding high income)Europe & Central Asia (IDA & IBRD countries)European UnionFaroe IslandsFijiFinlandFragile and conflict affected situationsFranceFrench PolynesiaGabonGambia, TheGeorgiaGermanyGhanaGibraltarGreeceGreenlandGrenadaGuamGuatemalaGuineaGuinea-BissauGuyanaHaitiHeavily indebted poor countries (HIPC)High incomeHondurasHong Kong SAR, ChinaHungaryIBRD onlyIcelandIDA & IBRD totalIDA blendIDA onlyIDA totalIndiaIndonesiaIran, Islamic Rep.IraqIrelandIsle of ManIsraelItalyJamaicaJapanJordanKazakhstanKenyaKiribatiKorea, Dem. People’s Rep.Korea, Rep.KuwaitKyrgyz RepublicLao PDRLate-demographic dividendLatin America & Caribbean Latin America & Caribbean (excluding high income)Latin America & the Caribbean (IDA & IBRD countries)LatviaLeast developed countries: UN classificationLebanonLesothoLiberiaLibyaLiechtensteinLithuaniaLow & middle incomeLow incomeLower middle incomeLuxembourgMacao SAR, ChinaMacedonia, FYRMadagascarMalawiMalaysiaMaldivesMaliMaltaMarshall IslandsMauritaniaMauritiusMexicoMicronesia, Fed. Sts.Middle East & North AfricaMiddle East & North Africa (excluding high income)Middle East & North Africa (IDA & IBRD countries)Middle incomeMoldovaMonacoMongoliaMontenegroMoroccoMozambiqueMyanmarNamibiaNauruNepalNetherlandsNew CaledoniaNew ZealandNicaraguaNigerNigeriaNorth AmericaNorthern Mariana IslandsNorwayOECD membersOmanOther small statesPacific island small statesPakistanPalauPanamaPapua New GuineaParaguayPeruPhilippinesPolandPortugalPost-demographic dividendPre-demographic dividendPuerto RicoQatarRomaniaRussian FederationRwandaSamoaSan MarinoSao Tome and PrincipeSaudi ArabiaSenegalSerbiaSeychellesSierra LeoneSingaporeSint Maarten (Dutch part)Slovak RepublicSloveniaSmall statesSolomon IslandsSomaliaSouth AfricaSouth AsiaSouth Asia (IDA & IBRD)South SudanSpainSri LankaSt. Kitts and NevisSt. LuciaSt. Vincent and the GrenadinesSub-Saharan Africa Sub-Saharan Africa (excluding high income)Sub-Saharan Africa (IDA & IBRD countries)SudanSurinameSwazilandSwedenSwitzerlandSyrian Arab RepublicTajikistanTanzaniaThailandTimor-LesteTogoTongaTrinidad and TobagoTunisiaTurkeyTurkmenistanTurks and Caicos IslandsTuvaluUgandaUkraineUnited Arab EmiratesUnited KingdomUnited StatesUpper middle incomeUruguayUzbekistanVanuatuVenezuela, RBVietnamVirgin Islands (U.S.)West Bank and GazaWorldYemen, Rep.ZambiaZimbabwe Timeline:
This timeline shows a graph from 1961 to 2016 of Mauritius. No data until 1960. Number of actual observations by date: 56.
Source name:
World Development Indicators
Source organization:
The data on urban population shares used to estimate rural population come from the United Nations, World Urbanization Prospects. Total population figures are World Bank estimates.
Categories, topics:
Agriculture & Rural Development
Last updated:
apr 23, 2017
Indicators value changes by year
Minimum:
440.598K
jan 1, 1961
Maximum:
761.717K
jan 1, 2016
At the date of observation
Value
Absolute change
Change from previous value
jan 1, 1961
440.598K
+440.598K
0.0%
jan 1, 1962
451.771K
+11.173K
2.54%
jan 1, 1963
461.509K
+9.738K
2.16%
jan 1, 1964
466.857K
+5.348K
1.16%
jan 1, 1965
471.114K
+4.257K
0.91%
jan 1, 1966
474.398K
+3.284K
0.7%
jan 1, 1967
476.764K
+2.366K
0.5%
jan 1, 1968
478.307K
+1.543K
0.32%
jan 1, 1969
479.096K
+789.0
0.16%
jan 1, 1970
479.254K
+158.0
0.03%
jan 1, 1971
478.816K
-438.0
-0.09%
jan 1, 1972
477.841K
-975.0
-0.2%
jan 1, 1973
476.298K
-1.543K
-0.32%
jan 1, 1974
485.328K
+9.03K
1.9%
jan 1, 1975
494.671K
+9.343K
1.93%
jan 1, 1976
504.488K
+9.817K
1.98%
jan 1, 1977
514.678K
+10.19K
2.02%
jan 1, 1978
525.14K
+10.462K
2.03%
jan 1, 1979
534.083K
+8.943K
1.7%
jan 1, 1980
545.53K
+11.447K
2.14%
jan 1, 1981
556.912K
+11.382K
2.09%
jan 1, 1982
567.354K
+10.442K
1.87%
jan 1, 1983
576.486K
+9.132K
1.61%
jan 1, 1984
583.976K
+7.49K
1.3%
jan 1, 1985
586.967K
+2.991K
0.51%
jan 1, 1986
588.59K
+1.623K
0.28%
jan 1, 1987
589.878K
+1.288K
0.22%
jan 1, 1988
591.054K
+1.176K
0.2%
jan 1, 1989
591.84K
+786.0
0.13%
jan 1, 1990
593.079K
+1.239K
0.21%
jan 1, 1991
593.973K
+894.0
0.15%
jan 1, 1992
601.736K
+7.763K
1.31%
jan 1, 1993
611.05K
+9.314K
1.55%
jan 1, 1994
619.687K
+8.637K
1.41%
jan 1, 1995
629.793K
+10.106K
1.63%
jan 1, 1996
636.613K
+6.82K
1.08%
jan 1, 1997
644.552K
+7.939K
1.25%
jan 1, 1998
654.086K
+9.534K
1.48%
jan 1, 1999
662.415K
+8.329K
1.27%
jan 1, 2000
672.335K
+9.92K
1.5%
jan 1, 2001
680.434K
+8.099K
1.2%
jan 1, 2002
688.344K
+7.91K
1.16%
jan 1, 2003
695.669K
+7.325K
1.06%
jan 1, 2004
703.269K
+7.6K
1.09%
jan 1, 2005
710.257K
+6.988K
0.99%
jan 1, 2006
717.042K
+6.785K
0.96%
jan 1, 2007
722.974K
+5.932K
0.83%
jan 1, 2008
728.865K
+5.891K
0.81%
jan 1, 2009
734.094K
+5.229K
0.72%
jan 1, 2010
738.64K
+4.546K
0.62%
jan 1, 2011
743.0K
+4.36K
0.59%
jan 1, 2012
746.783K
+3.783K
0.51%
jan 1, 2013
751.47K
+4.687K
0.63%
jan 1, 2014
755.456K
+3.986K
0.53%
jan 1, 2015
758.906K
+3.45K
0.46%
jan 1, 2016
761.717K
+2.811K
0.37%
Ranking of countries by current statistics by years


Comments: