29
/
en
AIzaSyAYiBZKx7MnpbEhh9jyipgxe19OcubqV5w
April 1, 2024
43852
Latin America & the Caribbean (IDA & IBRD countries)
TLA
false
2
1
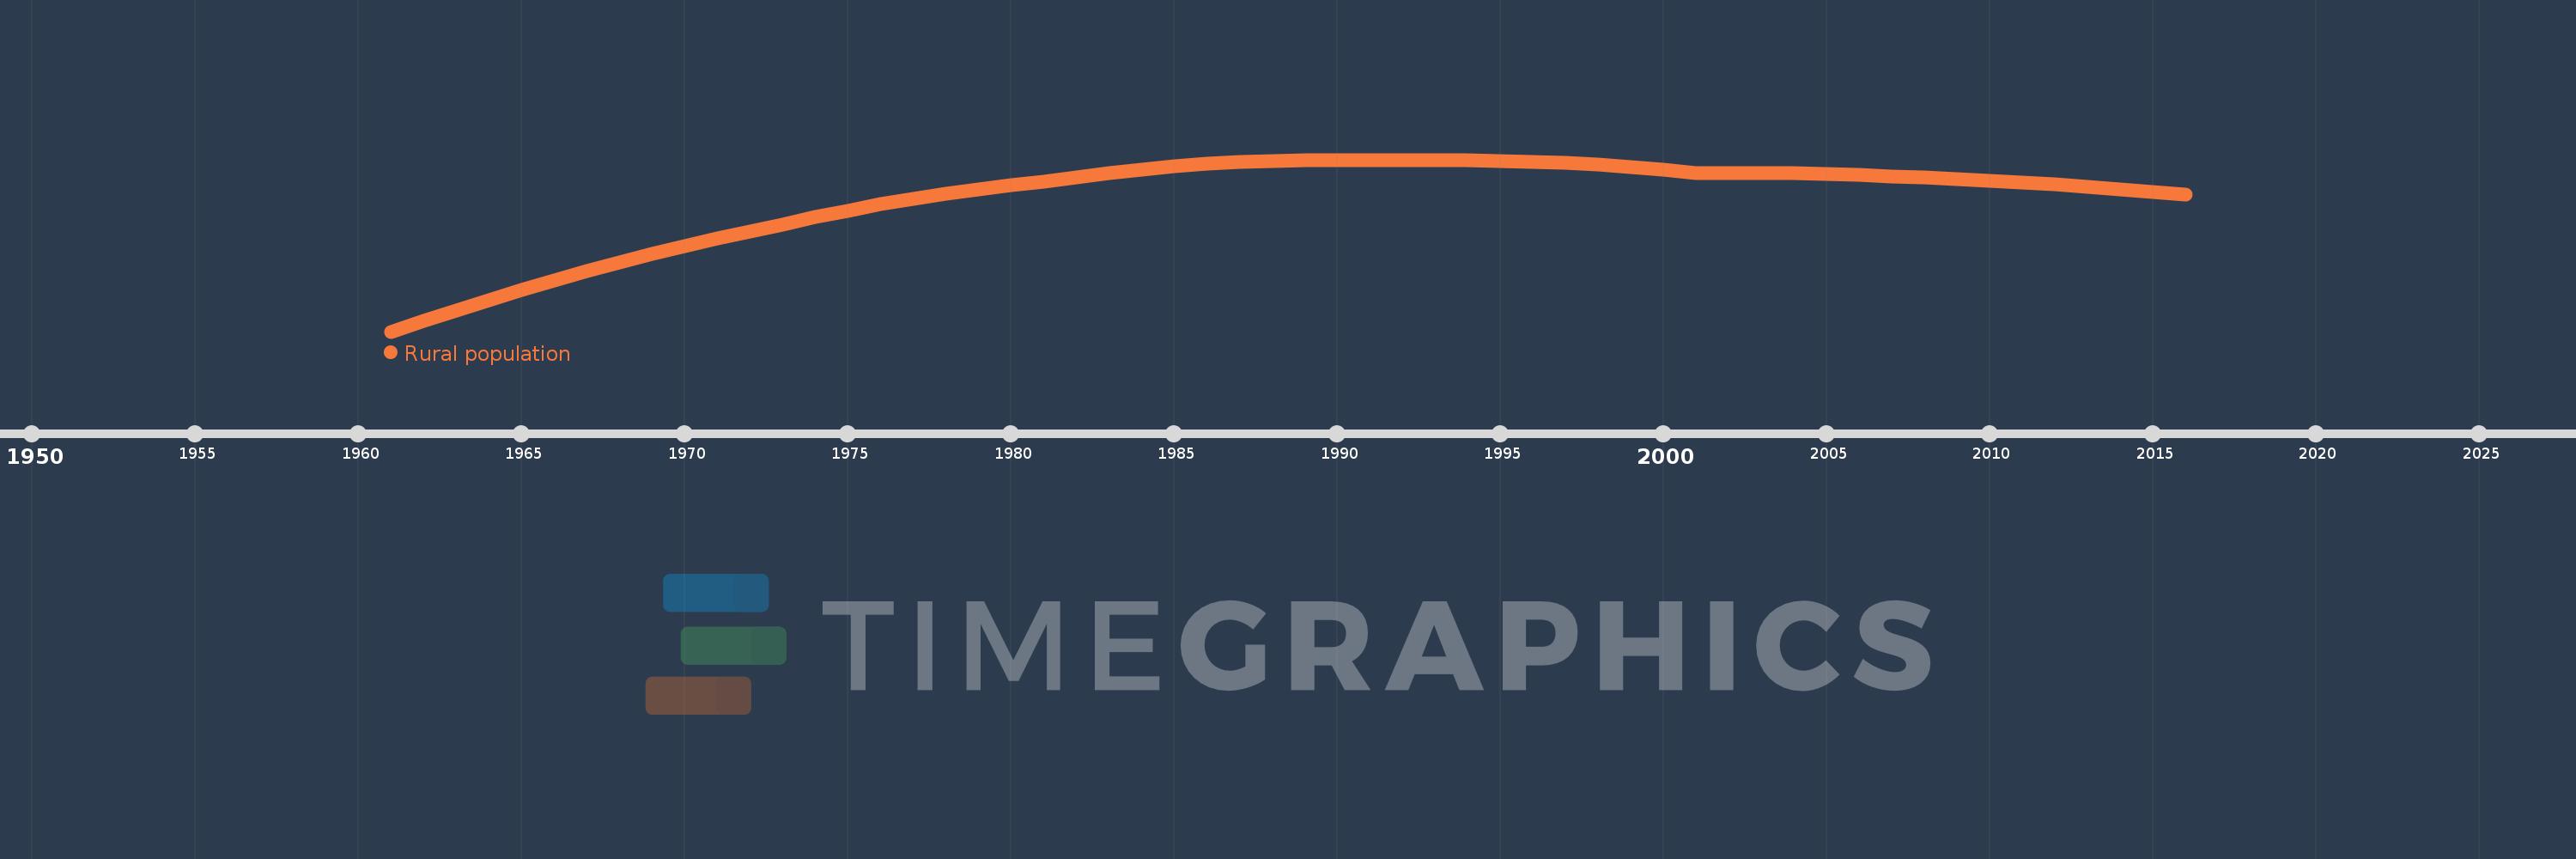
Rural population
2016,2015,2014,2013,2012,2011,2010,2009,2008,2007,2006,2005,2004,2003,2002,2001,2000,1999,1998,1997,1996,1995,1994,1993,1992,1991,1990,1989,1988,1987,1986,1985,1984,1983,1982,1981,1980,1979,1978,1977,1976,1975,1974,1973,1972,1971,1970,1969,1968,1967,1966,1965,1964,1963,1962,1961
This statistics in other country:
AfghanistanAlbaniaAlgeriaAmerican SamoaAndorraAngolaAntigua and BarbudaArab WorldArgentinaArmeniaArubaAustraliaAustriaAzerbaijanBahamas, TheBahrainBangladeshBarbadosBelarusBelgiumBelizeBeninBermudaBhutanBoliviaBosnia and HerzegovinaBotswanaBrazilBritish Virgin IslandsBrunei DarussalamBulgariaBurkina FasoBurundiCabo VerdeCambodiaCameroonCanadaCaribbean small statesCayman IslandsCentral African RepublicCentral Europe and the BalticsChadChannel IslandsChileChinaColombiaComorosCongo, Dem. Rep.Congo, Rep.Costa RicaCote d'IvoireCroatiaCubaCuracaoCyprusCzech RepublicDenmarkDjiboutiDominicaDominican RepublicEarly-demographic dividendEast Asia & PacificEast Asia & Pacific (excluding high income)East Asia & Pacific (IDA & IBRD countries)EcuadorEgypt, Arab Rep.El SalvadorEquatorial GuineaEritreaEstoniaEthiopiaEuro areaEurope & Central AsiaEurope & Central Asia (excluding high income)Europe & Central Asia (IDA & IBRD countries)European UnionFaroe IslandsFijiFinlandFragile and conflict affected situationsFranceFrench PolynesiaGabonGambia, TheGeorgiaGermanyGhanaGibraltarGreeceGreenlandGrenadaGuamGuatemalaGuineaGuinea-BissauGuyanaHaitiHeavily indebted poor countries (HIPC)High incomeHondurasHong Kong SAR, ChinaHungaryIBRD onlyIcelandIDA & IBRD totalIDA blendIDA onlyIDA totalIndiaIndonesiaIran, Islamic Rep.IraqIrelandIsle of ManIsraelItalyJamaicaJapanJordanKazakhstanKenyaKiribatiKorea, Dem. People’s Rep.Korea, Rep.KuwaitKyrgyz RepublicLao PDRLate-demographic dividendLatin America & Caribbean Latin America & Caribbean (excluding high income)Latin America & the Caribbean (IDA & IBRD countries)LatviaLeast developed countries: UN classificationLebanonLesothoLiberiaLibyaLiechtensteinLithuaniaLow & middle incomeLow incomeLower middle incomeLuxembourgMacao SAR, ChinaMacedonia, FYRMadagascarMalawiMalaysiaMaldivesMaliMaltaMarshall IslandsMauritaniaMauritiusMexicoMicronesia, Fed. Sts.Middle East & North AfricaMiddle East & North Africa (excluding high income)Middle East & North Africa (IDA & IBRD countries)Middle incomeMoldovaMonacoMongoliaMontenegroMoroccoMozambiqueMyanmarNamibiaNauruNepalNetherlandsNew CaledoniaNew ZealandNicaraguaNigerNigeriaNorth AmericaNorthern Mariana IslandsNorwayOECD membersOmanOther small statesPacific island small statesPakistanPalauPanamaPapua New GuineaParaguayPeruPhilippinesPolandPortugalPost-demographic dividendPre-demographic dividendPuerto RicoQatarRomaniaRussian FederationRwandaSamoaSan MarinoSao Tome and PrincipeSaudi ArabiaSenegalSerbiaSeychellesSierra LeoneSingaporeSint Maarten (Dutch part)Slovak RepublicSloveniaSmall statesSolomon IslandsSomaliaSouth AfricaSouth AsiaSouth Asia (IDA & IBRD)South SudanSpainSri LankaSt. Kitts and NevisSt. LuciaSt. Vincent and the GrenadinesSub-Saharan Africa Sub-Saharan Africa (excluding high income)Sub-Saharan Africa (IDA & IBRD countries)SudanSurinameSwazilandSwedenSwitzerlandSyrian Arab RepublicTajikistanTanzaniaThailandTimor-LesteTogoTongaTrinidad and TobagoTunisiaTurkeyTurkmenistanTurks and Caicos IslandsTuvaluUgandaUkraineUnited Arab EmiratesUnited KingdomUnited StatesUpper middle incomeUruguayUzbekistanVanuatuVenezuela, RBVietnamVirgin Islands (U.S.)West Bank and GazaWorldYemen, Rep.ZambiaZimbabwe Timeline:
This timeline shows a graph from 1961 to 2016 of Latin America & the Caribbean (IDA & IBRD countries). No data until 1960. Number of actual observations by date: 56.
Source name:
World Development Indicators
Source organization:
The data on urban population shares used to estimate rural population come from the United Nations, World Urbanization Prospects. Total population figures are World Bank estimates.
Categories, topics:
Agriculture & Rural Development
Last updated:
apr 23, 2017
Indicators value changes by year
Minimum:
107.314 mln
jan 1, 1961
Maximum:
128.4 mln
jan 1, 1990
At the date of observation
Value
Absolute change
Change from previous value
jan 1, 1961
107.314 mln
+107.314 mln
0.0%
jan 1, 1962
108.629 mln
+1.315 mln
1.23%
jan 1, 1963
109.922 mln
+1.293 mln
1.19%
jan 1, 1964
111.185 mln
+1.263 mln
1.15%
jan 1, 1965
112.379 mln
+1.195 mln
1.07%
jan 1, 1966
113.614 mln
+1.235 mln
1.1%
jan 1, 1967
114.77 mln
+1.156 mln
1.02%
jan 1, 1968
115.852 mln
+1.081 mln
0.94%
jan 1, 1969
116.861 mln
+1.009 mln
0.87%
jan 1, 1970
117.821 mln
+960.469K
0.82%
jan 1, 1971
118.741 mln
+920.198K
0.78%
jan 1, 1972
119.627 mln
+885.625K
0.75%
jan 1, 1973
120.483 mln
+856.445K
0.72%
jan 1, 1974
121.35 mln
+866.556K
0.72%
jan 1, 1975
122.177 mln
+827.135K
0.68%
jan 1, 1976
122.934 mln
+756.65K
0.62%
jan 1, 1977
123.627 mln
+693.034K
0.56%
jan 1, 1978
124.245 mln
+617.731K
0.5%
jan 1, 1979
124.795 mln
+549.901K
0.44%
jan 1, 1980
125.291 mln
+496.67K
0.4%
jan 1, 1981
125.741 mln
+449.372K
0.36%
jan 1, 1982
126.239 mln
+498.936K
0.4%
jan 1, 1983
126.742 mln
+502.257K
0.4%
jan 1, 1984
127.211 mln
+469.683K
0.37%
jan 1, 1985
127.599 mln
+387.822K
0.3%
jan 1, 1986
127.894 mln
+294.721K
0.23%
jan 1, 1987
128.125 mln
+231.507K
0.18%
jan 1, 1988
128.287 mln
+161.395K
0.13%
jan 1, 1989
128.368 mln
+81.2K
0.06%
jan 1, 1990
128.4 mln
+32.158K
0.03%
jan 1, 1991
128.39 mln
-10.682K
-0.01%
jan 1, 1992
128.388 mln
-1.758K
0.0%
jan 1, 1993
128.381 mln
-7.003K
-0.01%
jan 1, 1994
128.345 mln
-36.246K
-0.03%
jan 1, 1995
128.247 mln
-97.634K
-0.08%
jan 1, 1996
128.11 mln
-137.101K
-0.11%
jan 1, 1997
128.01 mln
-99.81K
-0.08%
jan 1, 1998
127.786 mln
-224.3K
-0.18%
jan 1, 1999
127.499 mln
-286.198K
-0.22%
jan 1, 2000
127.189 mln
-310.084K
-0.24%
jan 1, 2001
126.788 mln
-401.297K
-0.32%
jan 1, 2002
126.753 mln
-35.362K
-0.03%
jan 1, 2003
126.756 mln
+2.788K
0.0%
jan 1, 2004
126.718 mln
-37.957K
-0.03%
jan 1, 2005
126.626 mln
-91.888K
-0.07%
jan 1, 2006
126.517 mln
-108.514K
-0.09%
jan 1, 2007
126.388 mln
-129.213K
-0.1%
jan 1, 2008
126.238 mln
-149.863K
-0.12%
jan 1, 2009
126.062 mln
-175.679K
-0.14%
jan 1, 2010
125.864 mln
-198.432K
-0.16%
jan 1, 2011
125.63 mln
-234.109K
-0.19%
jan 1, 2012
125.362 mln
-267.935K
-0.21%
jan 1, 2013
125.08 mln
-281.959K
-0.22%
jan 1, 2014
124.783 mln
-297.217K
-0.24%
jan 1, 2015
124.469 mln
-313.855K
-0.25%
jan 1, 2016
124.142 mln
-326.568K
-0.26%
Ranking of countries by current statistics by years


Comments: