29
/
en
AIzaSyAYiBZKx7MnpbEhh9jyipgxe19OcubqV5w
April 1, 2024
276133
United Kingdom
GBR
true
2
1
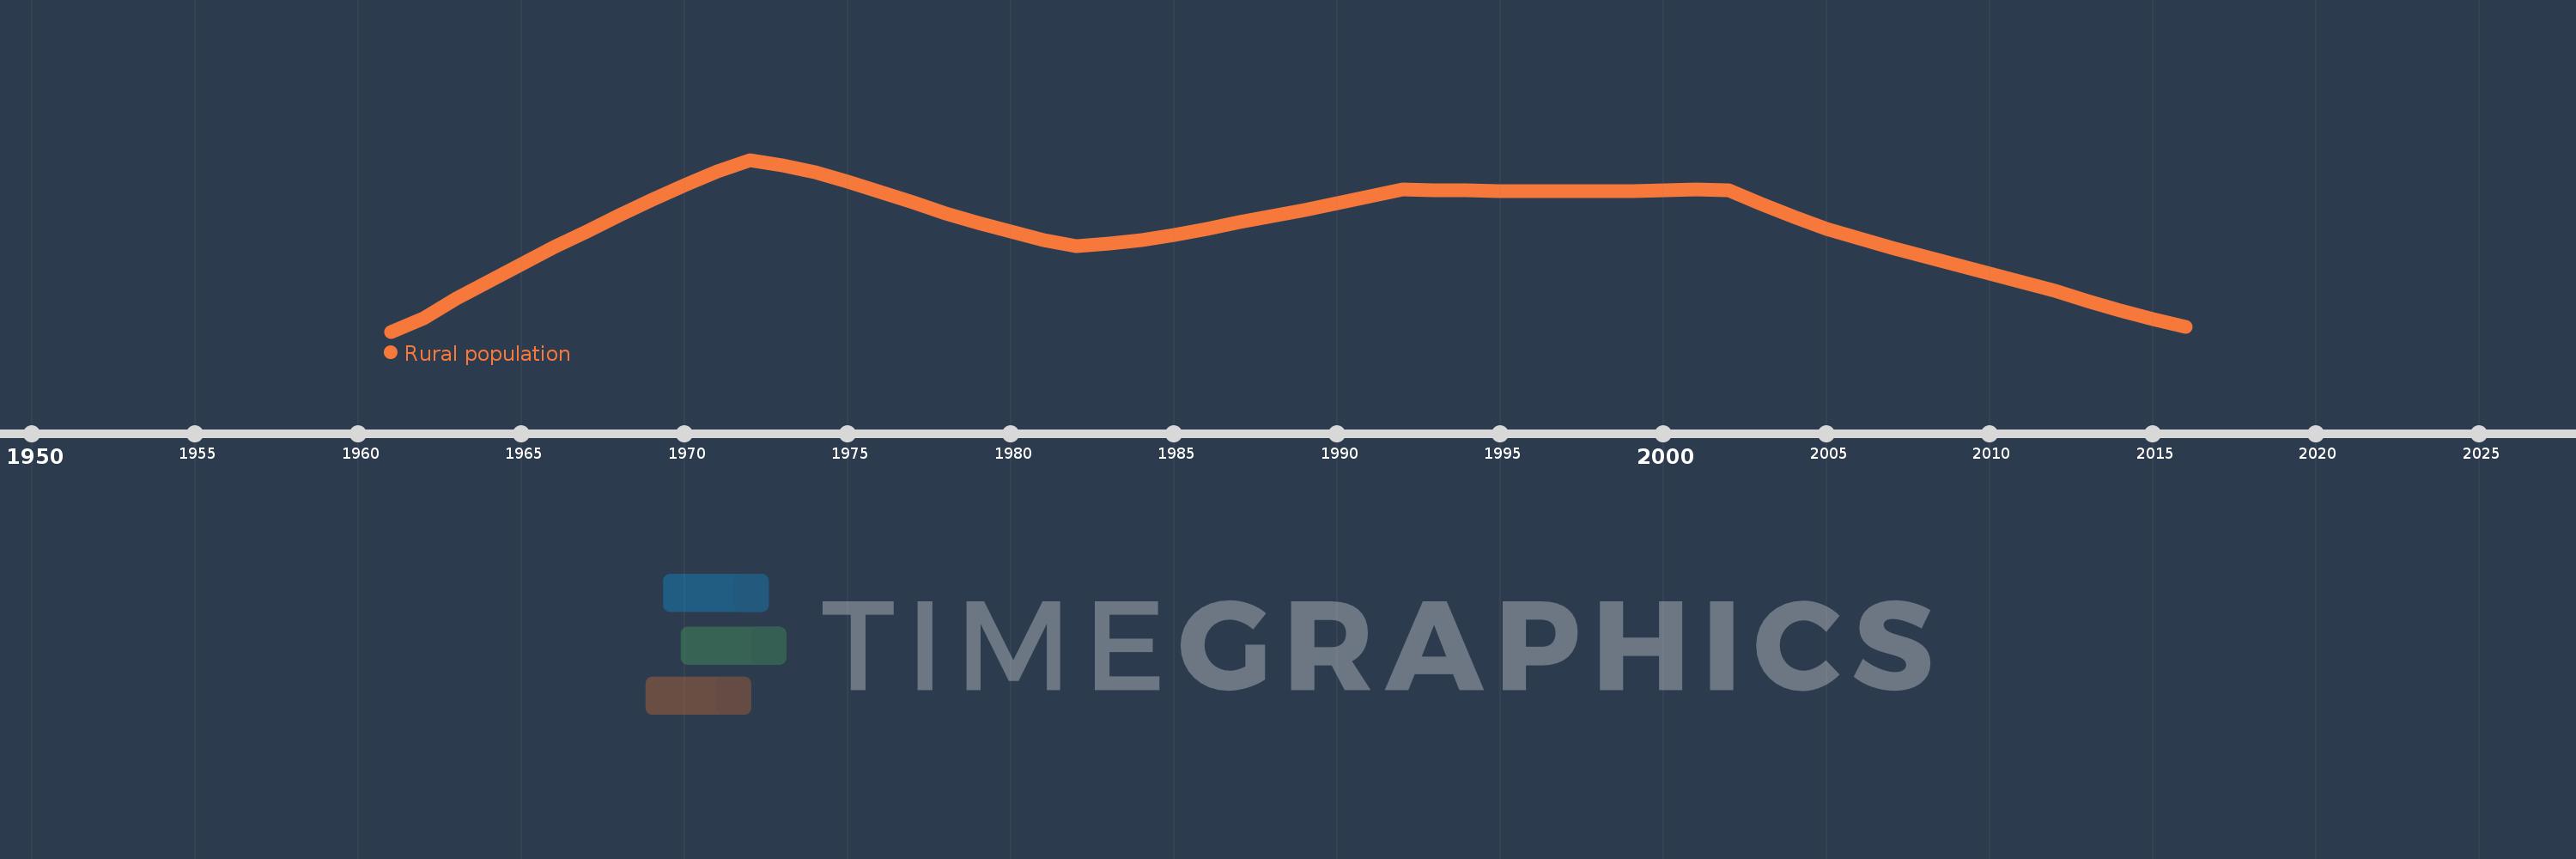
Rural population
2016,2015,2014,2013,2012,2011,2010,2009,2008,2007,2006,2005,2004,2003,2002,2001,2000,1999,1998,1997,1996,1995,1994,1993,1992,1991,1990,1989,1988,1987,1986,1985,1984,1983,1982,1981,1980,1979,1978,1977,1976,1975,1974,1973,1972,1971,1970,1969,1968,1967,1966,1965,1964,1963,1962,1961
This statistics in other country:
AfghanistanAlbaniaAlgeriaAmerican SamoaAndorraAngolaAntigua and BarbudaArab WorldArgentinaArmeniaArubaAustraliaAustriaAzerbaijanBahamas, TheBahrainBangladeshBarbadosBelarusBelgiumBelizeBeninBermudaBhutanBoliviaBosnia and HerzegovinaBotswanaBrazilBritish Virgin IslandsBrunei DarussalamBulgariaBurkina FasoBurundiCabo VerdeCambodiaCameroonCanadaCaribbean small statesCayman IslandsCentral African RepublicCentral Europe and the BalticsChadChannel IslandsChileChinaColombiaComorosCongo, Dem. Rep.Congo, Rep.Costa RicaCote d'IvoireCroatiaCubaCuracaoCyprusCzech RepublicDenmarkDjiboutiDominicaDominican RepublicEarly-demographic dividendEast Asia & PacificEast Asia & Pacific (excluding high income)East Asia & Pacific (IDA & IBRD countries)EcuadorEgypt, Arab Rep.El SalvadorEquatorial GuineaEritreaEstoniaEthiopiaEuro areaEurope & Central AsiaEurope & Central Asia (excluding high income)Europe & Central Asia (IDA & IBRD countries)European UnionFaroe IslandsFijiFinlandFragile and conflict affected situationsFranceFrench PolynesiaGabonGambia, TheGeorgiaGermanyGhanaGibraltarGreeceGreenlandGrenadaGuamGuatemalaGuineaGuinea-BissauGuyanaHaitiHeavily indebted poor countries (HIPC)High incomeHondurasHong Kong SAR, ChinaHungaryIBRD onlyIcelandIDA & IBRD totalIDA blendIDA onlyIDA totalIndiaIndonesiaIran, Islamic Rep.IraqIrelandIsle of ManIsraelItalyJamaicaJapanJordanKazakhstanKenyaKiribatiKorea, Dem. People’s Rep.Korea, Rep.KuwaitKyrgyz RepublicLao PDRLate-demographic dividendLatin America & Caribbean Latin America & Caribbean (excluding high income)Latin America & the Caribbean (IDA & IBRD countries)LatviaLeast developed countries: UN classificationLebanonLesothoLiberiaLibyaLiechtensteinLithuaniaLow & middle incomeLow incomeLower middle incomeLuxembourgMacao SAR, ChinaMacedonia, FYRMadagascarMalawiMalaysiaMaldivesMaliMaltaMarshall IslandsMauritaniaMauritiusMexicoMicronesia, Fed. Sts.Middle East & North AfricaMiddle East & North Africa (excluding high income)Middle East & North Africa (IDA & IBRD countries)Middle incomeMoldovaMonacoMongoliaMontenegroMoroccoMozambiqueMyanmarNamibiaNauruNepalNetherlandsNew CaledoniaNew ZealandNicaraguaNigerNigeriaNorth AmericaNorthern Mariana IslandsNorwayOECD membersOmanOther small statesPacific island small statesPakistanPalauPanamaPapua New GuineaParaguayPeruPhilippinesPolandPortugalPost-demographic dividendPre-demographic dividendPuerto RicoQatarRomaniaRussian FederationRwandaSamoaSan MarinoSao Tome and PrincipeSaudi ArabiaSenegalSerbiaSeychellesSierra LeoneSingaporeSint Maarten (Dutch part)Slovak RepublicSloveniaSmall statesSolomon IslandsSomaliaSouth AfricaSouth AsiaSouth Asia (IDA & IBRD)South SudanSpainSri LankaSt. Kitts and NevisSt. LuciaSt. Vincent and the GrenadinesSub-Saharan Africa Sub-Saharan Africa (excluding high income)Sub-Saharan Africa (IDA & IBRD countries)SudanSurinameSwazilandSwedenSwitzerlandSyrian Arab RepublicTajikistanTanzaniaThailandTimor-LesteTogoTongaTrinidad and TobagoTunisiaTurkeyTurkmenistanTurks and Caicos IslandsTuvaluUgandaUkraineUnited Arab EmiratesUnited KingdomUnited StatesUpper middle incomeUruguayUzbekistanVanuatuVenezuela, RBVietnamVirgin Islands (U.S.)West Bank and GazaWorldYemen, Rep.ZambiaZimbabwe Timeline:
This timeline shows a graph from 1961 to 2016 of United Kingdom. No data until 1960. Number of actual observations by date: 56.
Source name:
World Development Indicators
Source organization:
The data on urban population shares used to estimate rural population come from the United Nations, World Urbanization Prospects. Total population figures are World Bank estimates.
Categories, topics:
Agriculture & Rural Development
Last updated:
apr 23, 2017
Indicators value changes by year
Minimum:
11.295 mln
jan 1, 1961
Maximum:
12.839 mln
jan 1, 1972
At the date of observation
Value
Absolute change
Change from previous value
jan 1, 1961
11.295 mln
+11.295 mln
0.0%
jan 1, 1962
11.419 mln
+123.184K
1.09%
jan 1, 1963
11.589 mln
+170.27K
1.49%
jan 1, 1964
11.75 mln
+161.088K
1.39%
jan 1, 1965
11.902 mln
+151.714K
1.29%
jan 1, 1966
12.054 mln
+152.254K
1.28%
jan 1, 1967
12.196 mln
+142.598K
1.18%
jan 1, 1968
12.34 mln
+143.331K
1.18%
jan 1, 1969
12.478 mln
+138.061K
1.12%
jan 1, 1970
12.608 mln
+130.164K
1.04%
jan 1, 1971
12.737 mln
+129.413K
1.03%
jan 1, 1972
12.839 mln
+101.941K
0.8%
jan 1, 1973
12.79 mln
-48.935K
-0.38%
jan 1, 1974
12.724 mln
-66.862K
-0.52%
jan 1, 1975
12.64 mln
-83.629K
-0.66%
jan 1, 1976
12.548 mln
-92.024K
-0.73%
jan 1, 1977
12.454 mln
-93.588K
-0.75%
jan 1, 1978
12.36 mln
-94.565K
-0.76%
jan 1, 1979
12.271 mln
-88.69K
-0.72%
jan 1, 1980
12.193 mln
-78.417K
-0.64%
jan 1, 1981
12.118 mln
-74.396K
-0.61%
jan 1, 1982
12.062 mln
-56.057K
-0.46%
jan 1, 1983
12.085 mln
+23.271K
0.19%
jan 1, 1984
12.118 mln
+32.289K
0.27%
jan 1, 1985
12.165 mln
+46.84K
0.39%
jan 1, 1986
12.221 mln
+55.914K
0.46%
jan 1, 1987
12.277 mln
+56.677K
0.46%
jan 1, 1988
12.332 mln
+54.535K
0.44%
jan 1, 1989
12.388 mln
+55.879K
0.45%
jan 1, 1990
12.448 mln
+60.827K
0.49%
jan 1, 1991
12.514 mln
+65.891K
0.53%
jan 1, 1992
12.569 mln
+54.839K
0.44%
jan 1, 1993
12.569 mln
-511.0
0.0%
jan 1, 1994
12.564 mln
-4.462K
-0.04%
jan 1, 1995
12.561 mln
-3.271K
-0.03%
jan 1, 1996
12.559 mln
-1.538K
-0.01%
jan 1, 1997
12.556 mln
-2.88K
-0.02%
jan 1, 1998
12.554 mln
-2.025K
-0.02%
jan 1, 1999
12.556 mln
+1.545K
0.01%
jan 1, 2000
12.563 mln
+7.31K
0.06%
jan 1, 2001
12.573 mln
+9.634K
0.08%
jan 1, 2002
12.562 mln
-10.624K
-0.08%
jan 1, 2003
12.44 mln
-122.443K
-0.97%
jan 1, 2004
12.324 mln
-116.11K
-0.93%
jan 1, 2005
12.22 mln
-103.65K
-0.84%
jan 1, 2006
12.132 mln
-88.554K
-0.72%
jan 1, 2007
12.048 mln
-83.303K
-0.69%
jan 1, 2008
11.971 mln
-77.521K
-0.64%
jan 1, 2009
11.894 mln
-77.238K
-0.65%
jan 1, 2010
11.813 mln
-80.334K
-0.68%
jan 1, 2011
11.736 mln
-77.131K
-0.65%
jan 1, 2012
11.659 mln
-77.436K
-0.66%
jan 1, 2013
11.572 mln
-86.823K
-0.74%
jan 1, 2014
11.484 mln
-87.713K
-0.76%
jan 1, 2015
11.407 mln
-76.63K
-0.67%
jan 1, 2016
11.339 mln
-68.19K
-0.6%
Ranking of countries by current statistics by years


Comments: