29
/
en
AIzaSyAYiBZKx7MnpbEhh9jyipgxe19OcubqV5w
April 1, 2024
46646
Low income
LIC
false
2
1
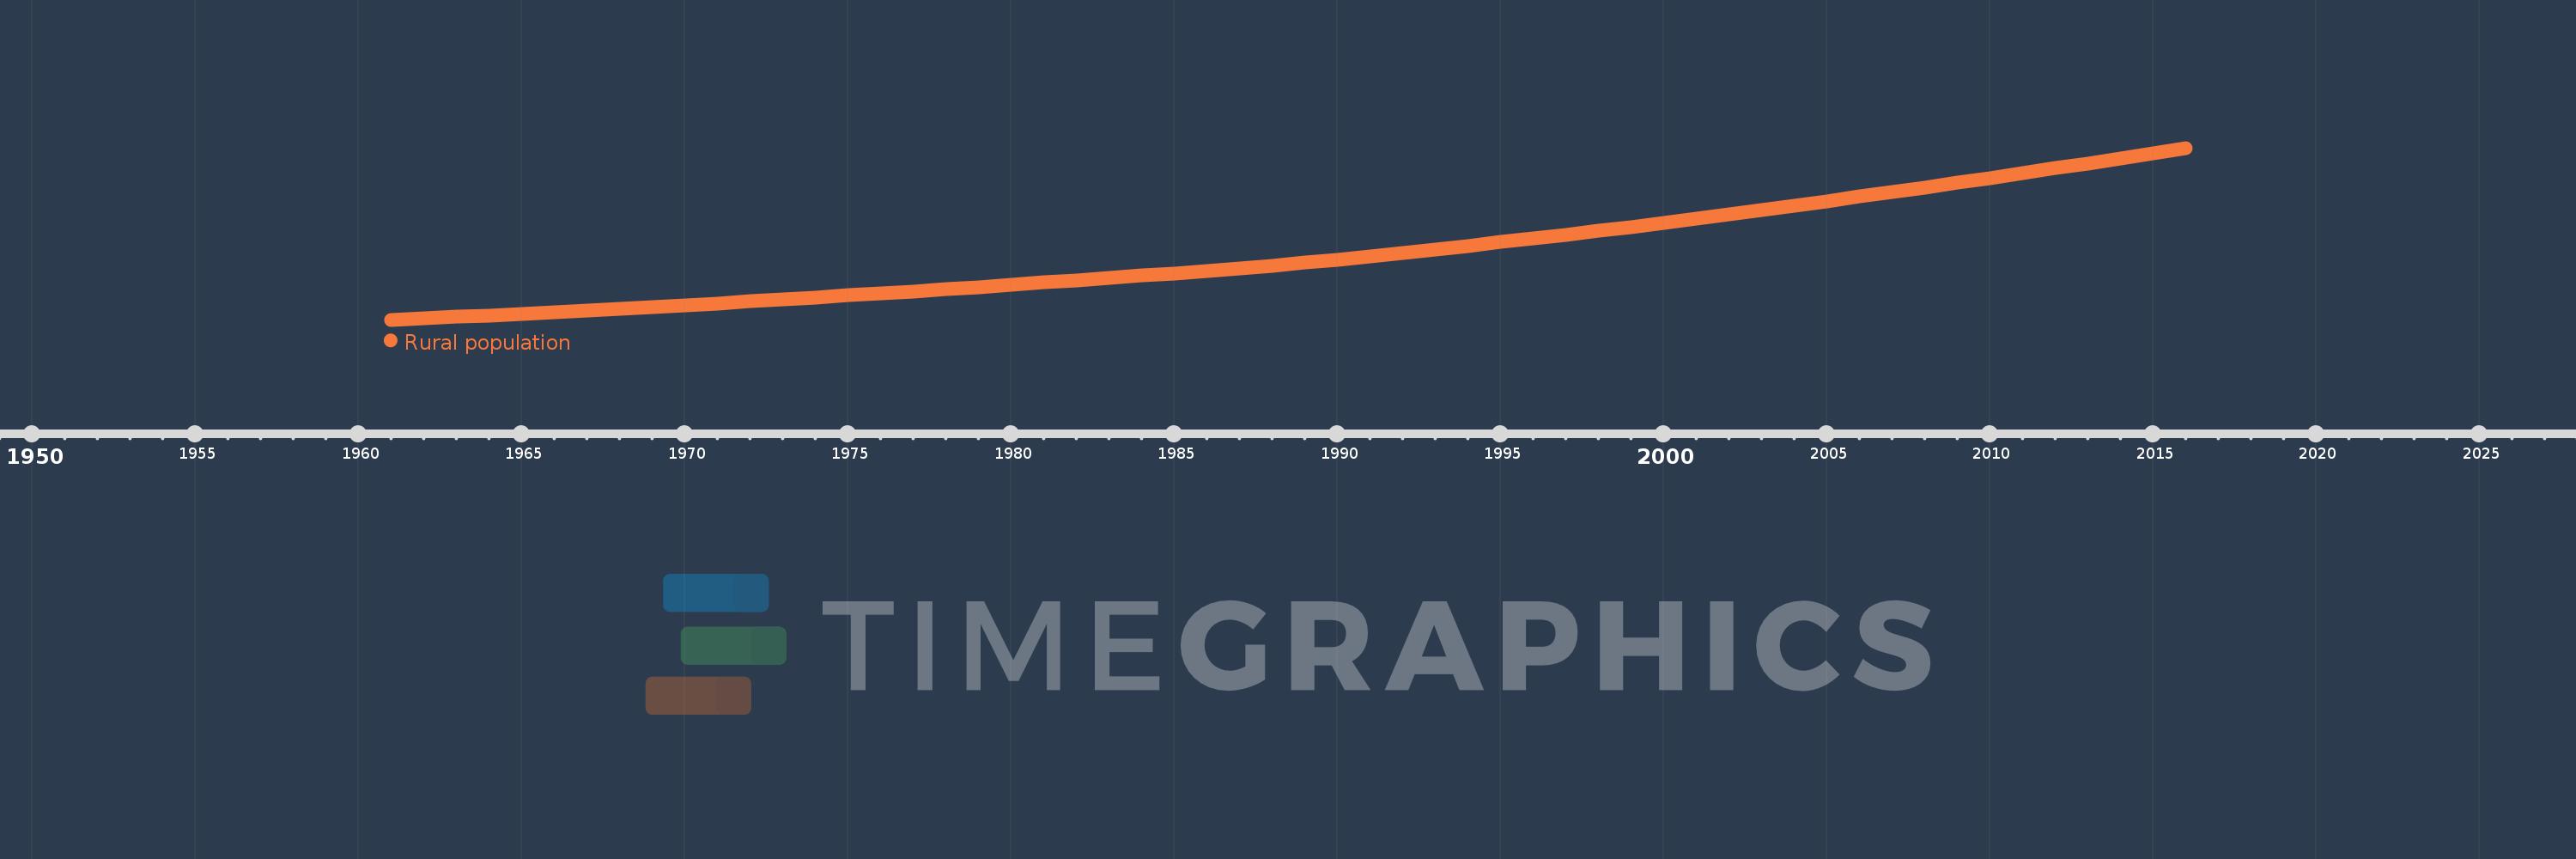
Rural population
2016,2015,2014,2013,2012,2011,2010,2009,2008,2007,2006,2005,2004,2003,2002,2001,2000,1999,1998,1997,1996,1995,1994,1993,1992,1991,1990,1989,1988,1987,1986,1985,1984,1983,1982,1981,1980,1979,1978,1977,1976,1975,1974,1973,1972,1971,1970,1969,1968,1967,1966,1965,1964,1963,1962,1961
This statistics in other country:
AfghanistanAlbaniaAlgeriaAmerican SamoaAndorraAngolaAntigua and BarbudaArab WorldArgentinaArmeniaArubaAustraliaAustriaAzerbaijanBahamas, TheBahrainBangladeshBarbadosBelarusBelgiumBelizeBeninBermudaBhutanBoliviaBosnia and HerzegovinaBotswanaBrazilBritish Virgin IslandsBrunei DarussalamBulgariaBurkina FasoBurundiCabo VerdeCambodiaCameroonCanadaCaribbean small statesCayman IslandsCentral African RepublicCentral Europe and the BalticsChadChannel IslandsChileChinaColombiaComorosCongo, Dem. Rep.Congo, Rep.Costa RicaCote d'IvoireCroatiaCubaCuracaoCyprusCzech RepublicDenmarkDjiboutiDominicaDominican RepublicEarly-demographic dividendEast Asia & PacificEast Asia & Pacific (excluding high income)East Asia & Pacific (IDA & IBRD countries)EcuadorEgypt, Arab Rep.El SalvadorEquatorial GuineaEritreaEstoniaEthiopiaEuro areaEurope & Central AsiaEurope & Central Asia (excluding high income)Europe & Central Asia (IDA & IBRD countries)European UnionFaroe IslandsFijiFinlandFragile and conflict affected situationsFranceFrench PolynesiaGabonGambia, TheGeorgiaGermanyGhanaGibraltarGreeceGreenlandGrenadaGuamGuatemalaGuineaGuinea-BissauGuyanaHaitiHeavily indebted poor countries (HIPC)High incomeHondurasHong Kong SAR, ChinaHungaryIBRD onlyIcelandIDA & IBRD totalIDA blendIDA onlyIDA totalIndiaIndonesiaIran, Islamic Rep.IraqIrelandIsle of ManIsraelItalyJamaicaJapanJordanKazakhstanKenyaKiribatiKorea, Dem. People’s Rep.Korea, Rep.KuwaitKyrgyz RepublicLao PDRLate-demographic dividendLatin America & Caribbean Latin America & Caribbean (excluding high income)Latin America & the Caribbean (IDA & IBRD countries)LatviaLeast developed countries: UN classificationLebanonLesothoLiberiaLibyaLiechtensteinLithuaniaLow & middle incomeLow incomeLower middle incomeLuxembourgMacao SAR, ChinaMacedonia, FYRMadagascarMalawiMalaysiaMaldivesMaliMaltaMarshall IslandsMauritaniaMauritiusMexicoMicronesia, Fed. Sts.Middle East & North AfricaMiddle East & North Africa (excluding high income)Middle East & North Africa (IDA & IBRD countries)Middle incomeMoldovaMonacoMongoliaMontenegroMoroccoMozambiqueMyanmarNamibiaNauruNepalNetherlandsNew CaledoniaNew ZealandNicaraguaNigerNigeriaNorth AmericaNorthern Mariana IslandsNorwayOECD membersOmanOther small statesPacific island small statesPakistanPalauPanamaPapua New GuineaParaguayPeruPhilippinesPolandPortugalPost-demographic dividendPre-demographic dividendPuerto RicoQatarRomaniaRussian FederationRwandaSamoaSan MarinoSao Tome and PrincipeSaudi ArabiaSenegalSerbiaSeychellesSierra LeoneSingaporeSint Maarten (Dutch part)Slovak RepublicSloveniaSmall statesSolomon IslandsSomaliaSouth AfricaSouth AsiaSouth Asia (IDA & IBRD)South SudanSpainSri LankaSt. Kitts and NevisSt. LuciaSt. Vincent and the GrenadinesSub-Saharan Africa Sub-Saharan Africa (excluding high income)Sub-Saharan Africa (IDA & IBRD countries)SudanSurinameSwazilandSwedenSwitzerlandSyrian Arab RepublicTajikistanTanzaniaThailandTimor-LesteTogoTongaTrinidad and TobagoTunisiaTurkeyTurkmenistanTurks and Caicos IslandsTuvaluUgandaUkraineUnited Arab EmiratesUnited KingdomUnited StatesUpper middle incomeUruguayUzbekistanVanuatuVenezuela, RBVietnamVirgin Islands (U.S.)West Bank and GazaWorldYemen, Rep.ZambiaZimbabwe Timeline:
This timeline shows a graph from 1961 to 2016 of Low income. No data until 1960. Number of actual observations by date: 56.
Source name:
World Development Indicators
Source organization:
The data on urban population shares used to estimate rural population come from the United Nations, World Urbanization Prospects. Total population figures are World Bank estimates.
Categories, topics:
Agriculture & Rural Development
Last updated:
apr 23, 2017
Indicators value changes by year
Minimum:
136.427 mln
jan 1, 1961
Maximum:
442.077 mln
jan 1, 2016
At the date of observation
Value
Absolute change
Change from previous value
jan 1, 1961
136.427 mln
+136.427 mln
0.0%
jan 1, 1962
138.945 mln
+2.518 mln
1.85%
jan 1, 1963
141.519 mln
+2.574 mln
1.85%
jan 1, 1964
144.158 mln
+2.639 mln
1.86%
jan 1, 1965
146.908 mln
+2.75 mln
1.91%
jan 1, 1966
149.793 mln
+2.885 mln
1.96%
jan 1, 1967
152.817 mln
+3.024 mln
2.02%
jan 1, 1968
155.963 mln
+3.146 mln
2.06%
jan 1, 1969
159.086 mln
+3.123 mln
2.0%
jan 1, 1970
162.181 mln
+3.094 mln
1.95%
jan 1, 1971
165.345 mln
+3.165 mln
1.95%
jan 1, 1972
168.864 mln
+3.518 mln
2.13%
jan 1, 1973
172.425 mln
+3.561 mln
2.11%
jan 1, 1974
176.032 mln
+3.608 mln
2.09%
jan 1, 1975
179.666 mln
+3.633 mln
2.06%
jan 1, 1976
183.328 mln
+3.662 mln
2.04%
jan 1, 1977
187.101 mln
+3.772 mln
2.06%
jan 1, 1978
190.91 mln
+3.809 mln
2.04%
jan 1, 1979
194.749 mln
+3.839 mln
2.01%
jan 1, 1980
198.727 mln
+3.978 mln
2.04%
jan 1, 1981
202.764 mln
+4.037 mln
2.03%
jan 1, 1982
206.763 mln
+3.999 mln
1.97%
jan 1, 1983
210.791 mln
+4.028 mln
1.95%
jan 1, 1984
214.855 mln
+4.064 mln
1.93%
jan 1, 1985
219.06 mln
+4.205 mln
1.96%
jan 1, 1986
223.427 mln
+4.367 mln
1.99%
jan 1, 1987
228.065 mln
+4.638 mln
2.08%
jan 1, 1988
232.966 mln
+4.901 mln
2.15%
jan 1, 1989
238.097 mln
+5.13 mln
2.2%
jan 1, 1990
243.496 mln
+5.399 mln
2.27%
jan 1, 1991
249.077 mln
+5.581 mln
2.29%
jan 1, 1992
255.002 mln
+5.925 mln
2.38%
jan 1, 1993
261.21 mln
+6.209 mln
2.43%
jan 1, 1994
267.662 mln
+6.452 mln
2.47%
jan 1, 1995
274.298 mln
+6.636 mln
2.48%
jan 1, 1996
281.037 mln
+6.738 mln
2.46%
jan 1, 1997
287.823 mln
+6.787 mln
2.41%
jan 1, 1998
294.608 mln
+6.785 mln
2.36%
jan 1, 1999
301.545 mln
+6.937 mln
2.35%
jan 1, 2000
308.664 mln
+7.119 mln
2.36%
jan 1, 2001
316.005 mln
+7.341 mln
2.38%
jan 1, 2002
323.502 mln
+7.497 mln
2.37%
jan 1, 2003
331.274 mln
+7.771 mln
2.4%
jan 1, 2004
339.209 mln
+7.935 mln
2.4%
jan 1, 2005
347.267 mln
+8.059 mln
2.38%
jan 1, 2006
355.373 mln
+8.106 mln
2.33%
jan 1, 2007
363.558 mln
+8.185 mln
2.3%
jan 1, 2008
371.825 mln
+8.267 mln
2.27%
jan 1, 2009
380.071 mln
+8.246 mln
2.22%
jan 1, 2010
388.479 mln
+8.408 mln
2.21%
jan 1, 2011
397.066 mln
+8.587 mln
2.21%
jan 1, 2012
405.842 mln
+8.776 mln
2.21%
jan 1, 2013
414.777 mln
+8.936 mln
2.2%
jan 1, 2014
423.835 mln
+9.057 mln
2.18%
jan 1, 2015
432.95 mln
+9.115 mln
2.15%
jan 1, 2016
442.077 mln
+9.127 mln
2.11%
Ranking of countries by current statistics by years


Comments: