29
/
en
AIzaSyAYiBZKx7MnpbEhh9jyipgxe19OcubqV5w
April 1, 2024
165512
Jordan
JOR
true
2
1
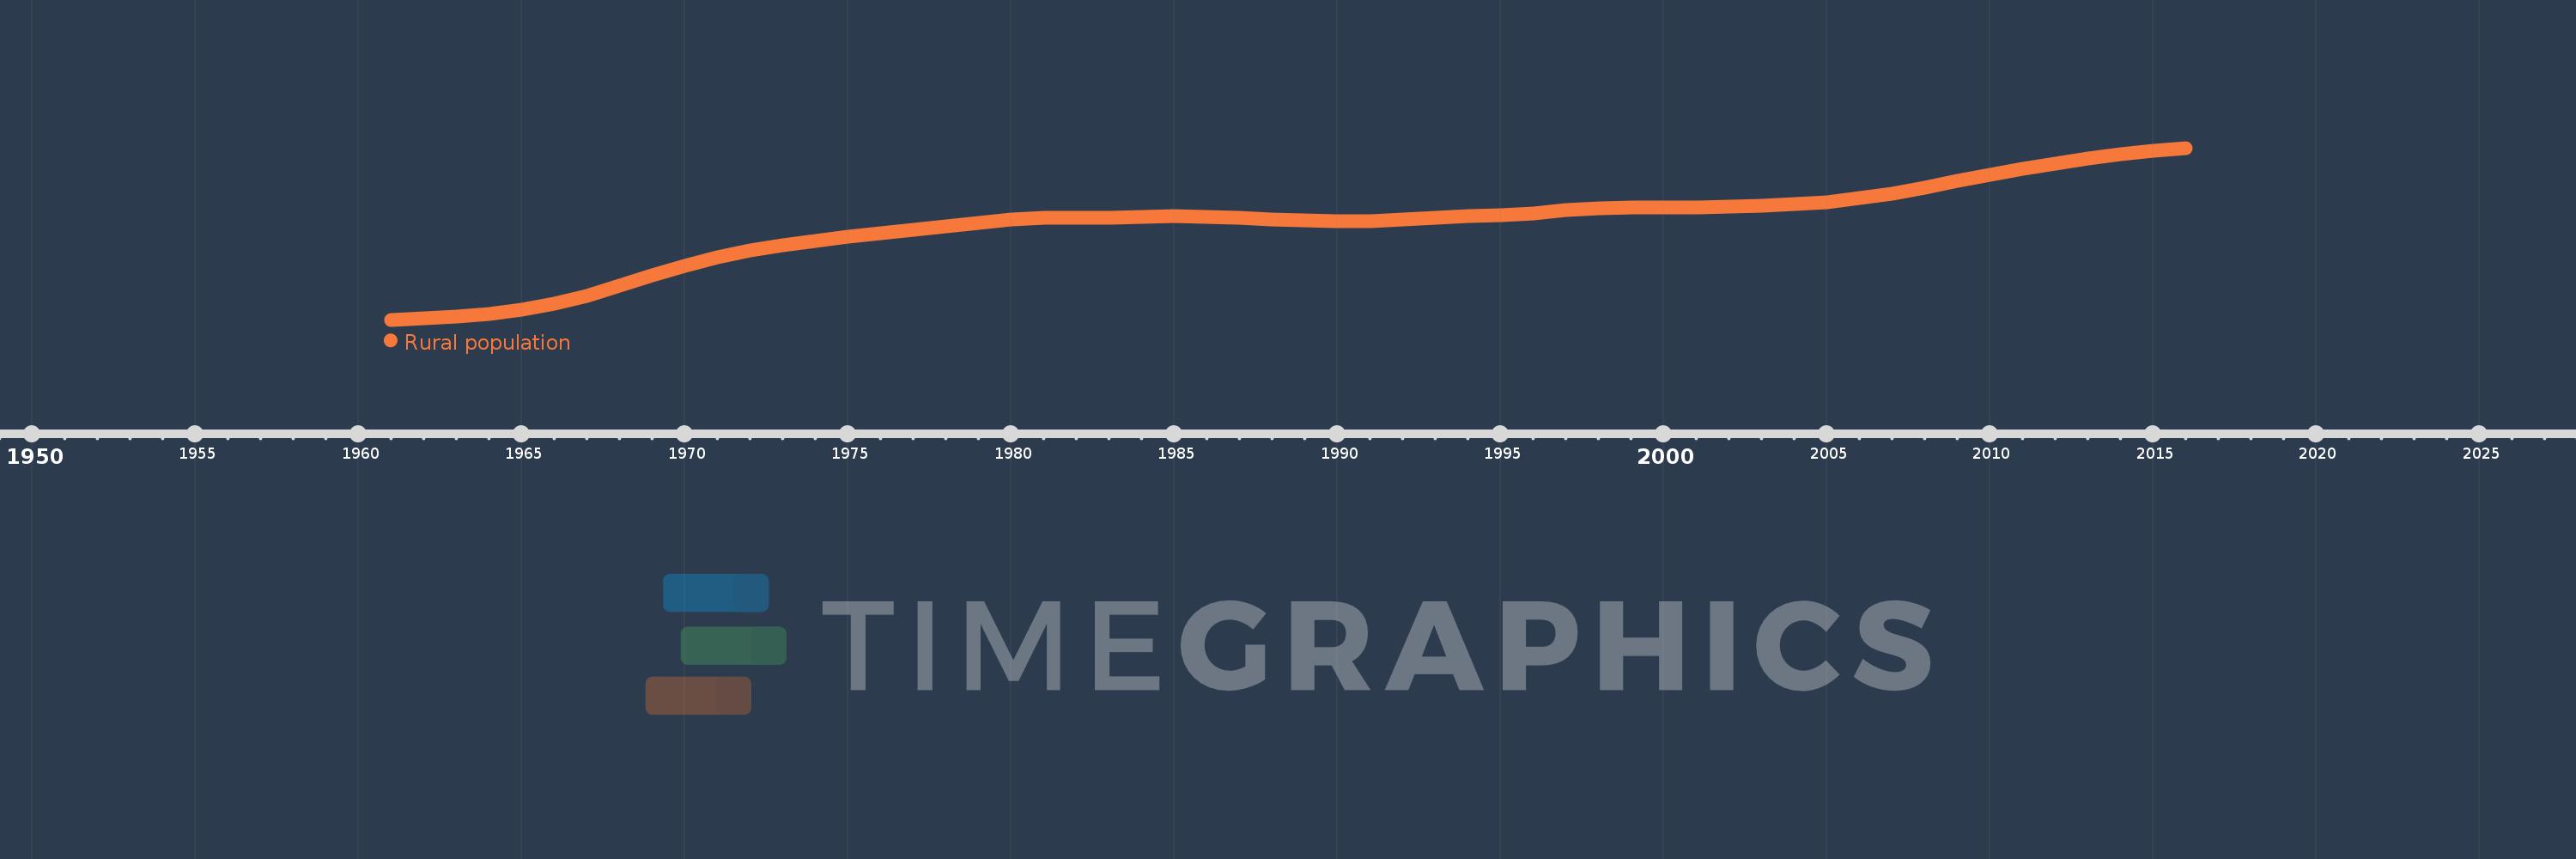
Rural population
2016,2015,2014,2013,2012,2011,2010,2009,2008,2007,2006,2005,2004,2003,2002,2001,2000,1999,1998,1997,1996,1995,1994,1993,1992,1991,1990,1989,1988,1987,1986,1985,1984,1983,1982,1981,1980,1979,1978,1977,1976,1975,1974,1973,1972,1971,1970,1969,1968,1967,1966,1965,1964,1963,1962,1961
This statistics in other country:
AfghanistanAlbaniaAlgeriaAmerican SamoaAndorraAngolaAntigua and BarbudaArab WorldArgentinaArmeniaArubaAustraliaAustriaAzerbaijanBahamas, TheBahrainBangladeshBarbadosBelarusBelgiumBelizeBeninBermudaBhutanBoliviaBosnia and HerzegovinaBotswanaBrazilBritish Virgin IslandsBrunei DarussalamBulgariaBurkina FasoBurundiCabo VerdeCambodiaCameroonCanadaCaribbean small statesCayman IslandsCentral African RepublicCentral Europe and the BalticsChadChannel IslandsChileChinaColombiaComorosCongo, Dem. Rep.Congo, Rep.Costa RicaCote d'IvoireCroatiaCubaCuracaoCyprusCzech RepublicDenmarkDjiboutiDominicaDominican RepublicEarly-demographic dividendEast Asia & PacificEast Asia & Pacific (excluding high income)East Asia & Pacific (IDA & IBRD countries)EcuadorEgypt, Arab Rep.El SalvadorEquatorial GuineaEritreaEstoniaEthiopiaEuro areaEurope & Central AsiaEurope & Central Asia (excluding high income)Europe & Central Asia (IDA & IBRD countries)European UnionFaroe IslandsFijiFinlandFragile and conflict affected situationsFranceFrench PolynesiaGabonGambia, TheGeorgiaGermanyGhanaGibraltarGreeceGreenlandGrenadaGuamGuatemalaGuineaGuinea-BissauGuyanaHaitiHeavily indebted poor countries (HIPC)High incomeHondurasHong Kong SAR, ChinaHungaryIBRD onlyIcelandIDA & IBRD totalIDA blendIDA onlyIDA totalIndiaIndonesiaIran, Islamic Rep.IraqIrelandIsle of ManIsraelItalyJamaicaJapanJordanKazakhstanKenyaKiribatiKorea, Dem. People’s Rep.Korea, Rep.KuwaitKyrgyz RepublicLao PDRLate-demographic dividendLatin America & Caribbean Latin America & Caribbean (excluding high income)Latin America & the Caribbean (IDA & IBRD countries)LatviaLeast developed countries: UN classificationLebanonLesothoLiberiaLibyaLiechtensteinLithuaniaLow & middle incomeLow incomeLower middle incomeLuxembourgMacao SAR, ChinaMacedonia, FYRMadagascarMalawiMalaysiaMaldivesMaliMaltaMarshall IslandsMauritaniaMauritiusMexicoMicronesia, Fed. Sts.Middle East & North AfricaMiddle East & North Africa (excluding high income)Middle East & North Africa (IDA & IBRD countries)Middle incomeMoldovaMonacoMongoliaMontenegroMoroccoMozambiqueMyanmarNamibiaNauruNepalNetherlandsNew CaledoniaNew ZealandNicaraguaNigerNigeriaNorth AmericaNorthern Mariana IslandsNorwayOECD membersOmanOther small statesPacific island small statesPakistanPalauPanamaPapua New GuineaParaguayPeruPhilippinesPolandPortugalPost-demographic dividendPre-demographic dividendPuerto RicoQatarRomaniaRussian FederationRwandaSamoaSan MarinoSao Tome and PrincipeSaudi ArabiaSenegalSerbiaSeychellesSierra LeoneSingaporeSint Maarten (Dutch part)Slovak RepublicSloveniaSmall statesSolomon IslandsSomaliaSouth AfricaSouth AsiaSouth Asia (IDA & IBRD)South SudanSpainSri LankaSt. Kitts and NevisSt. LuciaSt. Vincent and the GrenadinesSub-Saharan Africa Sub-Saharan Africa (excluding high income)Sub-Saharan Africa (IDA & IBRD countries)SudanSurinameSwazilandSwedenSwitzerlandSyrian Arab RepublicTajikistanTanzaniaThailandTimor-LesteTogoTongaTrinidad and TobagoTunisiaTurkeyTurkmenistanTurks and Caicos IslandsTuvaluUgandaUkraineUnited Arab EmiratesUnited KingdomUnited StatesUpper middle incomeUruguayUzbekistanVanuatuVenezuela, RBVietnamVirgin Islands (U.S.)West Bank and GazaWorldYemen, Rep.ZambiaZimbabwe Timeline:
This timeline shows a graph from 1961 to 2016 of Jordan. No data until 1960. Number of actual observations by date: 56.
Source name:
World Development Indicators
Source organization:
The data on urban population shares used to estimate rural population come from the United Nations, World Urbanization Prospects. Total population figures are World Bank estimates.
Categories, topics:
Agriculture & Rural Development
Last updated:
apr 23, 2017
Indicators value changes by year
Minimum:
436.505K
jan 1, 1961
Maximum:
1.24 mln
jan 1, 2016
At the date of observation
Value
Absolute change
Change from previous value
jan 1, 1961
436.505K
+436.505K
0.0%
jan 1, 1962
441.545K
+5.04K
1.15%
jan 1, 1963
450.438K
+8.893K
2.01%
jan 1, 1964
464.585K
+14.147K
3.14%
jan 1, 1965
484.237K
+19.652K
4.23%
jan 1, 1966
512.173K
+27.936K
5.77%
jan 1, 1967
549.649K
+37.476K
7.32%
jan 1, 1968
594.754K
+45.105K
8.21%
jan 1, 1969
643.284K
+48.53K
8.16%
jan 1, 1970
689.279K
+45.995K
7.15%
jan 1, 1971
728.578K
+39.299K
5.7%
jan 1, 1972
760.198K
+31.62K
4.34%
jan 1, 1973
785.536K
+25.338K
3.33%
jan 1, 1974
806.0K
+20.464K
2.61%
jan 1, 1975
823.794K
+17.794K
2.21%
jan 1, 1976
840.699K
+16.905K
2.05%
jan 1, 1977
856.754K
+16.055K
1.91%
jan 1, 1978
871.911K
+15.157K
1.77%
jan 1, 1979
887.666K
+15.755K
1.81%
jan 1, 1980
905.952K
+18.286K
2.06%
jan 1, 1981
911.607K
+5.655K
0.62%
jan 1, 1982
911.633K
+26.0
0.0%
jan 1, 1983
914.204K
+2.571K
0.28%
jan 1, 1984
917.549K
+3.345K
0.37%
jan 1, 1985
919.329K
+1.78K
0.19%
jan 1, 1986
918.463K
-866.0
-0.09%
jan 1, 1987
913.816K
-4.647K
-0.51%
jan 1, 1988
906.455K
-7.361K
-0.81%
jan 1, 1989
899.207K
-7.248K
-0.8%
jan 1, 1990
895.601K
-3.606K
-0.4%
jan 1, 1991
897.009K
+1.408K
0.16%
jan 1, 1992
903.951K
+6.942K
0.77%
jan 1, 1993
914.046K
+10.095K
1.12%
jan 1, 1994
922.824K
+8.778K
0.96%
jan 1, 1995
924.861K
+2.037K
0.22%
jan 1, 1996
934.666K
+9.805K
1.06%
jan 1, 1997
949.227K
+14.561K
1.56%
jan 1, 1998
956.729K
+7.502K
0.79%
jan 1, 1999
959.434K
+2.705K
0.28%
jan 1, 2000
960.565K
+1.131K
0.12%
jan 1, 2001
962.649K
+2.084K
0.22%
jan 1, 2002
965.826K
+3.177K
0.33%
jan 1, 2003
969.809K
+3.983K
0.41%
jan 1, 2004
976.336K
+6.527K
0.67%
jan 1, 2005
987.316K
+10.98K
1.12%
jan 1, 2006
1.004 mln
+16.511K
1.67%
jan 1, 2007
1.026 mln
+22.471K
2.24%
jan 1, 2008
1.054 mln
+27.446K
2.67%
jan 1, 2009
1.084 mln
+30.226K
2.87%
jan 1, 2010
1.114 mln
+30.279K
2.79%
jan 1, 2011
1.142 mln
+28.145K
2.53%
jan 1, 2012
1.168 mln
+25.528K
2.23%
jan 1, 2013
1.191 mln
+23.233K
1.99%
jan 1, 2014
1.211 mln
+20.143K
1.69%
jan 1, 2015
1.228 mln
+16.286K
1.34%
jan 1, 2016
1.24 mln
+11.922K
0.97%
Ranking of countries by current statistics by years


Comments: