29
/
en
AIzaSyAYiBZKx7MnpbEhh9jyipgxe19OcubqV5w
April 1, 2024
26102
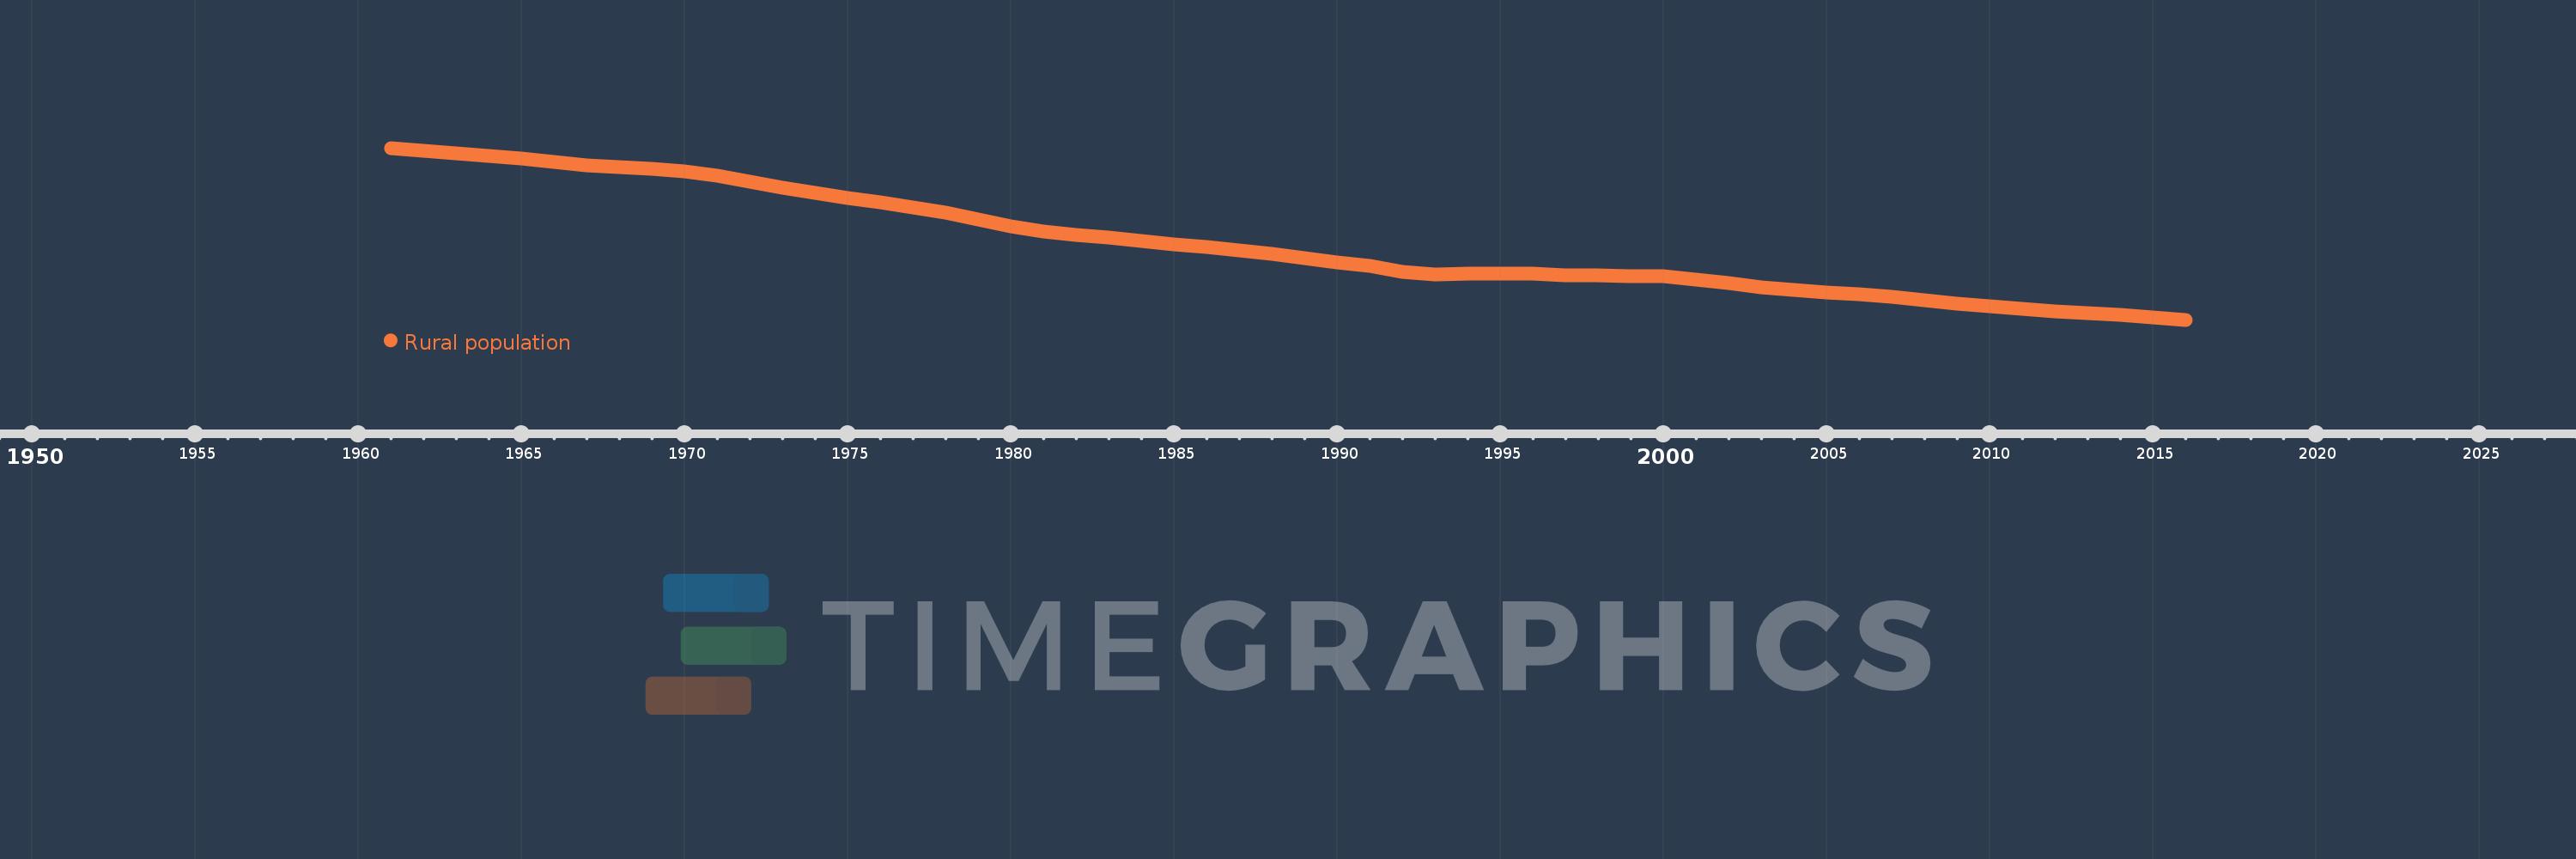
Central Europe and the Baltics
CEB
false
2
1
Rural population
2016,2015,2014,2013,2012,2011,2010,2009,2008,2007,2006,2005,2004,2003,2002,2001,2000,1999,1998,1997,1996,1995,1994,1993,1992,1991,1990,1989,1988,1987,1986,1985,1984,1983,1982,1981,1980,1979,1978,1977,1976,1975,1974,1973,1972,1971,1970,1969,1968,1967,1966,1965,1964,1963,1962,1961
This statistics in other country:
AfghanistanAlbaniaAlgeriaAmerican SamoaAndorraAngolaAntigua and BarbudaArab WorldArgentinaArmeniaArubaAustraliaAustriaAzerbaijanBahamas, TheBahrainBangladeshBarbadosBelarusBelgiumBelizeBeninBermudaBhutanBoliviaBosnia and HerzegovinaBotswanaBrazilBritish Virgin IslandsBrunei DarussalamBulgariaBurkina FasoBurundiCabo VerdeCambodiaCameroonCanadaCaribbean small statesCayman IslandsCentral African RepublicCentral Europe and the BalticsChadChannel IslandsChileChinaColombiaComorosCongo, Dem. Rep.Congo, Rep.Costa RicaCote d'IvoireCroatiaCubaCuracaoCyprusCzech RepublicDenmarkDjiboutiDominicaDominican RepublicEarly-demographic dividendEast Asia & PacificEast Asia & Pacific (excluding high income)East Asia & Pacific (IDA & IBRD countries)EcuadorEgypt, Arab Rep.El SalvadorEquatorial GuineaEritreaEstoniaEthiopiaEuro areaEurope & Central AsiaEurope & Central Asia (excluding high income)Europe & Central Asia (IDA & IBRD countries)European UnionFaroe IslandsFijiFinlandFragile and conflict affected situationsFranceFrench PolynesiaGabonGambia, TheGeorgiaGermanyGhanaGibraltarGreeceGreenlandGrenadaGuamGuatemalaGuineaGuinea-BissauGuyanaHaitiHeavily indebted poor countries (HIPC)High incomeHondurasHong Kong SAR, ChinaHungaryIBRD onlyIcelandIDA & IBRD totalIDA blendIDA onlyIDA totalIndiaIndonesiaIran, Islamic Rep.IraqIrelandIsle of ManIsraelItalyJamaicaJapanJordanKazakhstanKenyaKiribatiKorea, Dem. People’s Rep.Korea, Rep.KuwaitKyrgyz RepublicLao PDRLate-demographic dividendLatin America & Caribbean Latin America & Caribbean (excluding high income)Latin America & the Caribbean (IDA & IBRD countries)LatviaLeast developed countries: UN classificationLebanonLesothoLiberiaLibyaLiechtensteinLithuaniaLow & middle incomeLow incomeLower middle incomeLuxembourgMacao SAR, ChinaMacedonia, FYRMadagascarMalawiMalaysiaMaldivesMaliMaltaMarshall IslandsMauritaniaMauritiusMexicoMicronesia, Fed. Sts.Middle East & North AfricaMiddle East & North Africa (excluding high income)Middle East & North Africa (IDA & IBRD countries)Middle incomeMoldovaMonacoMongoliaMontenegroMoroccoMozambiqueMyanmarNamibiaNauruNepalNetherlandsNew CaledoniaNew ZealandNicaraguaNigerNigeriaNorth AmericaNorthern Mariana IslandsNorwayOECD membersOmanOther small statesPacific island small statesPakistanPalauPanamaPapua New GuineaParaguayPeruPhilippinesPolandPortugalPost-demographic dividendPre-demographic dividendPuerto RicoQatarRomaniaRussian FederationRwandaSamoaSan MarinoSao Tome and PrincipeSaudi ArabiaSenegalSerbiaSeychellesSierra LeoneSingaporeSint Maarten (Dutch part)Slovak RepublicSloveniaSmall statesSolomon IslandsSomaliaSouth AfricaSouth AsiaSouth Asia (IDA & IBRD)South SudanSpainSri LankaSt. Kitts and NevisSt. LuciaSt. Vincent and the GrenadinesSub-Saharan Africa Sub-Saharan Africa (excluding high income)Sub-Saharan Africa (IDA & IBRD countries)SudanSurinameSwazilandSwedenSwitzerlandSyrian Arab RepublicTajikistanTanzaniaThailandTimor-LesteTogoTongaTrinidad and TobagoTunisiaTurkeyTurkmenistanTurks and Caicos IslandsTuvaluUgandaUkraineUnited Arab EmiratesUnited KingdomUnited StatesUpper middle incomeUruguayUzbekistanVanuatuVenezuela, RBVietnamVirgin Islands (U.S.)West Bank and GazaWorldYemen, Rep.ZambiaZimbabwe Timeline:
This timeline shows a graph from 1961 to 2016 of Central Europe and the Baltics. No data until 1960. Number of actual observations by date: 56.
Source name:
World Development Indicators
Source organization:
The data on urban population shares used to estimate rural population come from the United Nations, World Urbanization Prospects. Total population figures are World Bank estimates.
Categories, topics:
Agriculture & Rural Development
Last updated:
apr 23, 2017
Indicators value changes by year
Minimum:
38.894 mln
jan 1, 2016
Maximum:
50.721 mln
jan 1, 1961
At the date of observation
Value
Absolute change
Change from previous value
jan 1, 1961
50.721 mln
+50.721 mln
0.0%
jan 1, 1962
50.54 mln
-180.844K
-0.36%
jan 1, 1963
50.352 mln
-187.638K
-0.37%
jan 1, 1964
50.175 mln
-176.674K
-0.35%
jan 1, 1965
50.005 mln
-170.23K
-0.34%
jan 1, 1966
49.747 mln
-258.536K
-0.52%
jan 1, 1967
49.512 mln
-235.069K
-0.47%
jan 1, 1968
49.426 mln
-85.181K
-0.17%
jan 1, 1969
49.295 mln
-131.617K
-0.27%
jan 1, 1970
49.088 mln
-206.421K
-0.42%
jan 1, 1971
48.793 mln
-295.425K
-0.6%
jan 1, 1972
48.395 mln
-397.916K
-0.82%
jan 1, 1973
48.012 mln
-383.254K
-0.79%
jan 1, 1974
47.633 mln
-378.477K
-0.79%
jan 1, 1975
47.275 mln
-357.996K
-0.75%
jan 1, 1976
46.957 mln
-318.277K
-0.67%
jan 1, 1977
46.633 mln
-323.954K
-0.69%
jan 1, 1978
46.24 mln
-392.82K
-0.84%
jan 1, 1979
45.775 mln
-465.226K
-1.01%
jan 1, 1980
45.322 mln
-453.165K
-0.99%
jan 1, 1981
44.946 mln
-375.964K
-0.83%
jan 1, 1982
44.712 mln
-234.299K
-0.52%
jan 1, 1983
44.527 mln
-184.603K
-0.41%
jan 1, 1984
44.326 mln
-201.384K
-0.45%
jan 1, 1985
44.107 mln
-218.592K
-0.49%
jan 1, 1986
43.882 mln
-224.873K
-0.51%
jan 1, 1987
43.655 mln
-226.843K
-0.52%
jan 1, 1988
43.414 mln
-241.055K
-0.55%
jan 1, 1989
43.146 mln
-268.454K
-0.62%
jan 1, 1990
42.867 mln
-279.232K
-0.65%
jan 1, 1991
42.614 mln
-252.752K
-0.59%
jan 1, 1992
42.195 mln
-418.439K
-0.98%
jan 1, 1993
42.0 mln
-195.591K
-0.46%
jan 1, 1994
42.074 mln
+73.947K
0.18%
jan 1, 1995
42.081 mln
+7.459K
0.02%
jan 1, 1996
42.079 mln
-2.024K
0.0%
jan 1, 1997
41.967 mln
-111.964K
-0.27%
jan 1, 1998
41.965 mln
-2.451K
-0.01%
jan 1, 1999
41.9 mln
-65.154K
-0.16%
jan 1, 2000
41.897 mln
-2.672K
-0.01%
jan 1, 2001
41.663 mln
-233.959K
-0.56%
jan 1, 2002
41.43 mln
-232.99K
-0.56%
jan 1, 2003
41.103 mln
-327.098K
-0.79%
jan 1, 2004
40.935 mln
-167.74K
-0.41%
jan 1, 2005
40.783 mln
-151.884K
-0.37%
jan 1, 2006
40.624 mln
-159.193K
-0.39%
jan 1, 2007
40.466 mln
-157.761K
-0.39%
jan 1, 2008
40.21 mln
-256.079K
-0.63%
jan 1, 2009
39.985 mln
-225.331K
-0.56%
jan 1, 2010
39.85 mln
-134.834K
-0.34%
jan 1, 2011
39.665 mln
-185.581K
-0.47%
jan 1, 2012
39.482 mln
-182.063K
-0.46%
jan 1, 2013
39.348 mln
-134.473K
-0.34%
jan 1, 2014
39.206 mln
-141.756K
-0.36%
jan 1, 2015
39.05 mln
-156.385K
-0.4%
jan 1, 2016
38.894 mln
-156.117K
-0.4%
Ranking of countries by current statistics by years


Comments: