29
/
en
AIzaSyAYiBZKx7MnpbEhh9jyipgxe19OcubqV5w
April 1, 2024
33031
Europe & Central Asia (IDA & IBRD countries)
TEC
false
2
1
Rural population
2016,2015,2014,2013,2012,2011,2010,2009,2008,2007,2006,2005,2004,2003,2002,2001,2000,1999,1998,1997,1996,1995,1994,1993,1992,1991,1990,1989,1988,1987,1986,1985,1984,1983,1982,1981,1980,1979,1978,1977,1976,1975,1974,1973,1972,1971,1970,1969,1968,1967,1966,1965,1964,1963,1962,1961
This statistics in other country:
AfghanistanAlbaniaAlgeriaAmerican SamoaAndorraAngolaAntigua and BarbudaArab WorldArgentinaArmeniaArubaAustraliaAustriaAzerbaijanBahamas, TheBahrainBangladeshBarbadosBelarusBelgiumBelizeBeninBermudaBhutanBoliviaBosnia and HerzegovinaBotswanaBrazilBritish Virgin IslandsBrunei DarussalamBulgariaBurkina FasoBurundiCabo VerdeCambodiaCameroonCanadaCaribbean small statesCayman IslandsCentral African RepublicCentral Europe and the BalticsChadChannel IslandsChileChinaColombiaComorosCongo, Dem. Rep.Congo, Rep.Costa RicaCote d'IvoireCroatiaCubaCuracaoCyprusCzech RepublicDenmarkDjiboutiDominicaDominican RepublicEarly-demographic dividendEast Asia & PacificEast Asia & Pacific (excluding high income)East Asia & Pacific (IDA & IBRD countries)EcuadorEgypt, Arab Rep.El SalvadorEquatorial GuineaEritreaEstoniaEthiopiaEuro areaEurope & Central AsiaEurope & Central Asia (excluding high income)Europe & Central Asia (IDA & IBRD countries)European UnionFaroe IslandsFijiFinlandFragile and conflict affected situationsFranceFrench PolynesiaGabonGambia, TheGeorgiaGermanyGhanaGibraltarGreeceGreenlandGrenadaGuamGuatemalaGuineaGuinea-BissauGuyanaHaitiHeavily indebted poor countries (HIPC)High incomeHondurasHong Kong SAR, ChinaHungaryIBRD onlyIcelandIDA & IBRD totalIDA blendIDA onlyIDA totalIndiaIndonesiaIran, Islamic Rep.IraqIrelandIsle of ManIsraelItalyJamaicaJapanJordanKazakhstanKenyaKiribatiKorea, Dem. People’s Rep.Korea, Rep.KuwaitKyrgyz RepublicLao PDRLate-demographic dividendLatin America & Caribbean Latin America & Caribbean (excluding high income)Latin America & the Caribbean (IDA & IBRD countries)LatviaLeast developed countries: UN classificationLebanonLesothoLiberiaLibyaLiechtensteinLithuaniaLow & middle incomeLow incomeLower middle incomeLuxembourgMacao SAR, ChinaMacedonia, FYRMadagascarMalawiMalaysiaMaldivesMaliMaltaMarshall IslandsMauritaniaMauritiusMexicoMicronesia, Fed. Sts.Middle East & North AfricaMiddle East & North Africa (excluding high income)Middle East & North Africa (IDA & IBRD countries)Middle incomeMoldovaMonacoMongoliaMontenegroMoroccoMozambiqueMyanmarNamibiaNauruNepalNetherlandsNew CaledoniaNew ZealandNicaraguaNigerNigeriaNorth AmericaNorthern Mariana IslandsNorwayOECD membersOmanOther small statesPacific island small statesPakistanPalauPanamaPapua New GuineaParaguayPeruPhilippinesPolandPortugalPost-demographic dividendPre-demographic dividendPuerto RicoQatarRomaniaRussian FederationRwandaSamoaSan MarinoSao Tome and PrincipeSaudi ArabiaSenegalSerbiaSeychellesSierra LeoneSingaporeSint Maarten (Dutch part)Slovak RepublicSloveniaSmall statesSolomon IslandsSomaliaSouth AfricaSouth AsiaSouth Asia (IDA & IBRD)South SudanSpainSri LankaSt. Kitts and NevisSt. LuciaSt. Vincent and the GrenadinesSub-Saharan Africa Sub-Saharan Africa (excluding high income)Sub-Saharan Africa (IDA & IBRD countries)SudanSurinameSwazilandSwedenSwitzerlandSyrian Arab RepublicTajikistanTanzaniaThailandTimor-LesteTogoTongaTrinidad and TobagoTunisiaTurkeyTurkmenistanTurks and Caicos IslandsTuvaluUgandaUkraineUnited Arab EmiratesUnited KingdomUnited StatesUpper middle incomeUruguayUzbekistanVanuatuVenezuela, RBVietnamVirgin Islands (U.S.)West Bank and GazaWorldYemen, Rep.ZambiaZimbabwe Timeline:
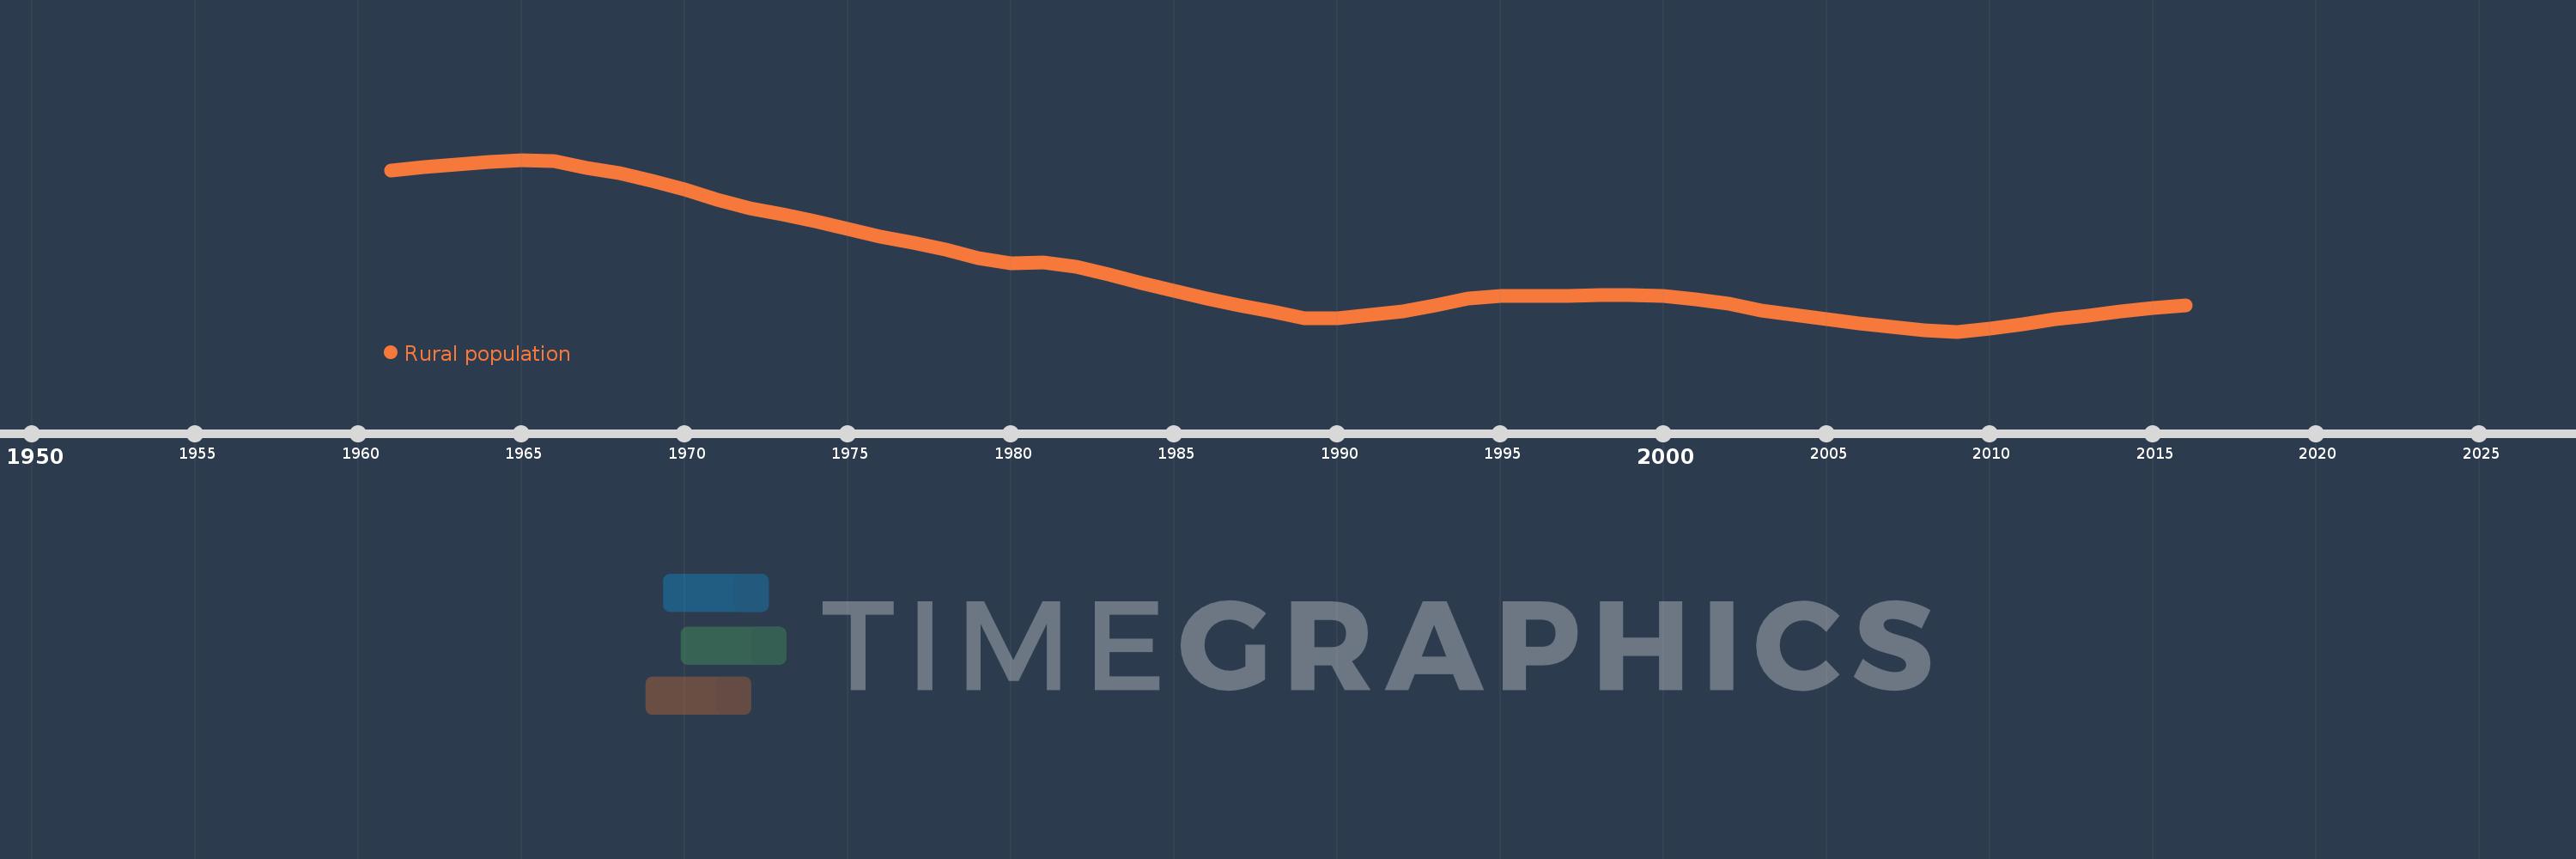
This timeline shows a graph from 1961 to 2016 of Europe & Central Asia (IDA & IBRD countries). No data until 1960. Number of actual observations by date: 56.
Source name:
World Development Indicators
Source organization:
The data on urban population shares used to estimate rural population come from the United Nations, World Urbanization Prospects. Total population figures are World Bank estimates.
Categories, topics:
Agriculture & Rural Development
Last updated:
apr 23, 2017
Indicators value changes by year
Minimum:
157.854 mln
jan 1, 2009
Maximum:
170.183 mln
jan 1, 1965
At the date of observation
Value
Absolute change
Change from previous value
jan 1, 1961
169.423 mln
+169.423 mln
0.0%
jan 1, 1962
169.635 mln
+211.713K
0.12%
jan 1, 1963
169.862 mln
+227.402K
0.13%
jan 1, 1964
170.058 mln
+195.776K
0.12%
jan 1, 1965
170.183 mln
+125.618K
0.07%
jan 1, 1966
170.097 mln
-86.846K
-0.05%
jan 1, 1967
169.624 mln
-472.744K
-0.28%
jan 1, 1968
169.198 mln
-426.116K
-0.25%
jan 1, 1969
168.675 mln
-523.129K
-0.31%
jan 1, 1970
168.061 mln
-613.605K
-0.36%
jan 1, 1971
167.322 mln
-739.374K
-0.44%
jan 1, 1972
166.723 mln
-599.022K
-0.36%
jan 1, 1973
166.287 mln
-435.798K
-0.26%
jan 1, 1974
165.753 mln
-533.725K
-0.32%
jan 1, 1975
165.201 mln
-551.783K
-0.33%
jan 1, 1976
164.689 mln
-512.756K
-0.31%
jan 1, 1977
164.244 mln
-444.859K
-0.27%
jan 1, 1978
163.73 mln
-513.628K
-0.31%
jan 1, 1979
163.126 mln
-604.291K
-0.37%
jan 1, 1980
162.778 mln
-347.468K
-0.21%
jan 1, 1981
162.81 mln
+31.926K
0.02%
jan 1, 1982
162.489 mln
-320.847K
-0.2%
jan 1, 1983
161.947 mln
-542.88K
-0.33%
jan 1, 1984
161.358 mln
-588.69K
-0.36%
jan 1, 1985
160.784 mln
-573.885K
-0.36%
jan 1, 1986
160.215 mln
-568.941K
-0.35%
jan 1, 1987
159.755 mln
-459.761K
-0.29%
jan 1, 1988
159.319 mln
-436.426K
-0.27%
jan 1, 1989
158.78 mln
-538.82K
-0.34%
jan 1, 1990
158.78 mln
-295.0
0.0%
jan 1, 1991
159.083 mln
+303.507K
0.19%
jan 1, 1992
159.293 mln
+210.059K
0.13%
jan 1, 1993
159.717 mln
+423.566K
0.27%
jan 1, 1994
160.212 mln
+494.995K
0.31%
jan 1, 1995
160.383 mln
+170.749K
0.11%
jan 1, 1996
160.43 mln
+47.748K
0.03%
jan 1, 1997
160.415 mln
-14.916K
-0.01%
jan 1, 1998
160.495 mln
+79.974K
0.05%
jan 1, 1999
160.484 mln
-11.275K
-0.01%
jan 1, 2000
160.44 mln
-43.85K
-0.03%
jan 1, 2001
160.162 mln
-277.84K
-0.17%
jan 1, 2002
159.837 mln
-325.343K
-0.2%
jan 1, 2003
159.386 mln
-451.336K
-0.28%
jan 1, 2004
159.036 mln
-349.901K
-0.22%
jan 1, 2005
158.731 mln
-304.519K
-0.19%
jan 1, 2006
158.442 mln
-289.213K
-0.18%
jan 1, 2007
158.196 mln
-246.496K
-0.16%
jan 1, 2008
157.932 mln
-263.806K
-0.17%
jan 1, 2009
157.854 mln
-78.312K
-0.05%
jan 1, 2010
158.071 mln
+217.981K
0.14%
jan 1, 2011
158.38 mln
+308.484K
0.2%
jan 1, 2012
158.733 mln
+353.041K
0.22%
jan 1, 2013
159.0 mln
+267.365K
0.17%
jan 1, 2014
159.293 mln
+292.489K
0.18%
jan 1, 2015
159.547 mln
+253.848K
0.16%
jan 1, 2016
159.715 mln
+168.574K
0.11%
Ranking of countries by current statistics by years


Comments: