29
/
en
AIzaSyAYiBZKx7MnpbEhh9jyipgxe19OcubqV5w
April 1, 2024
188461
Malaysia
MYS
true
2
1
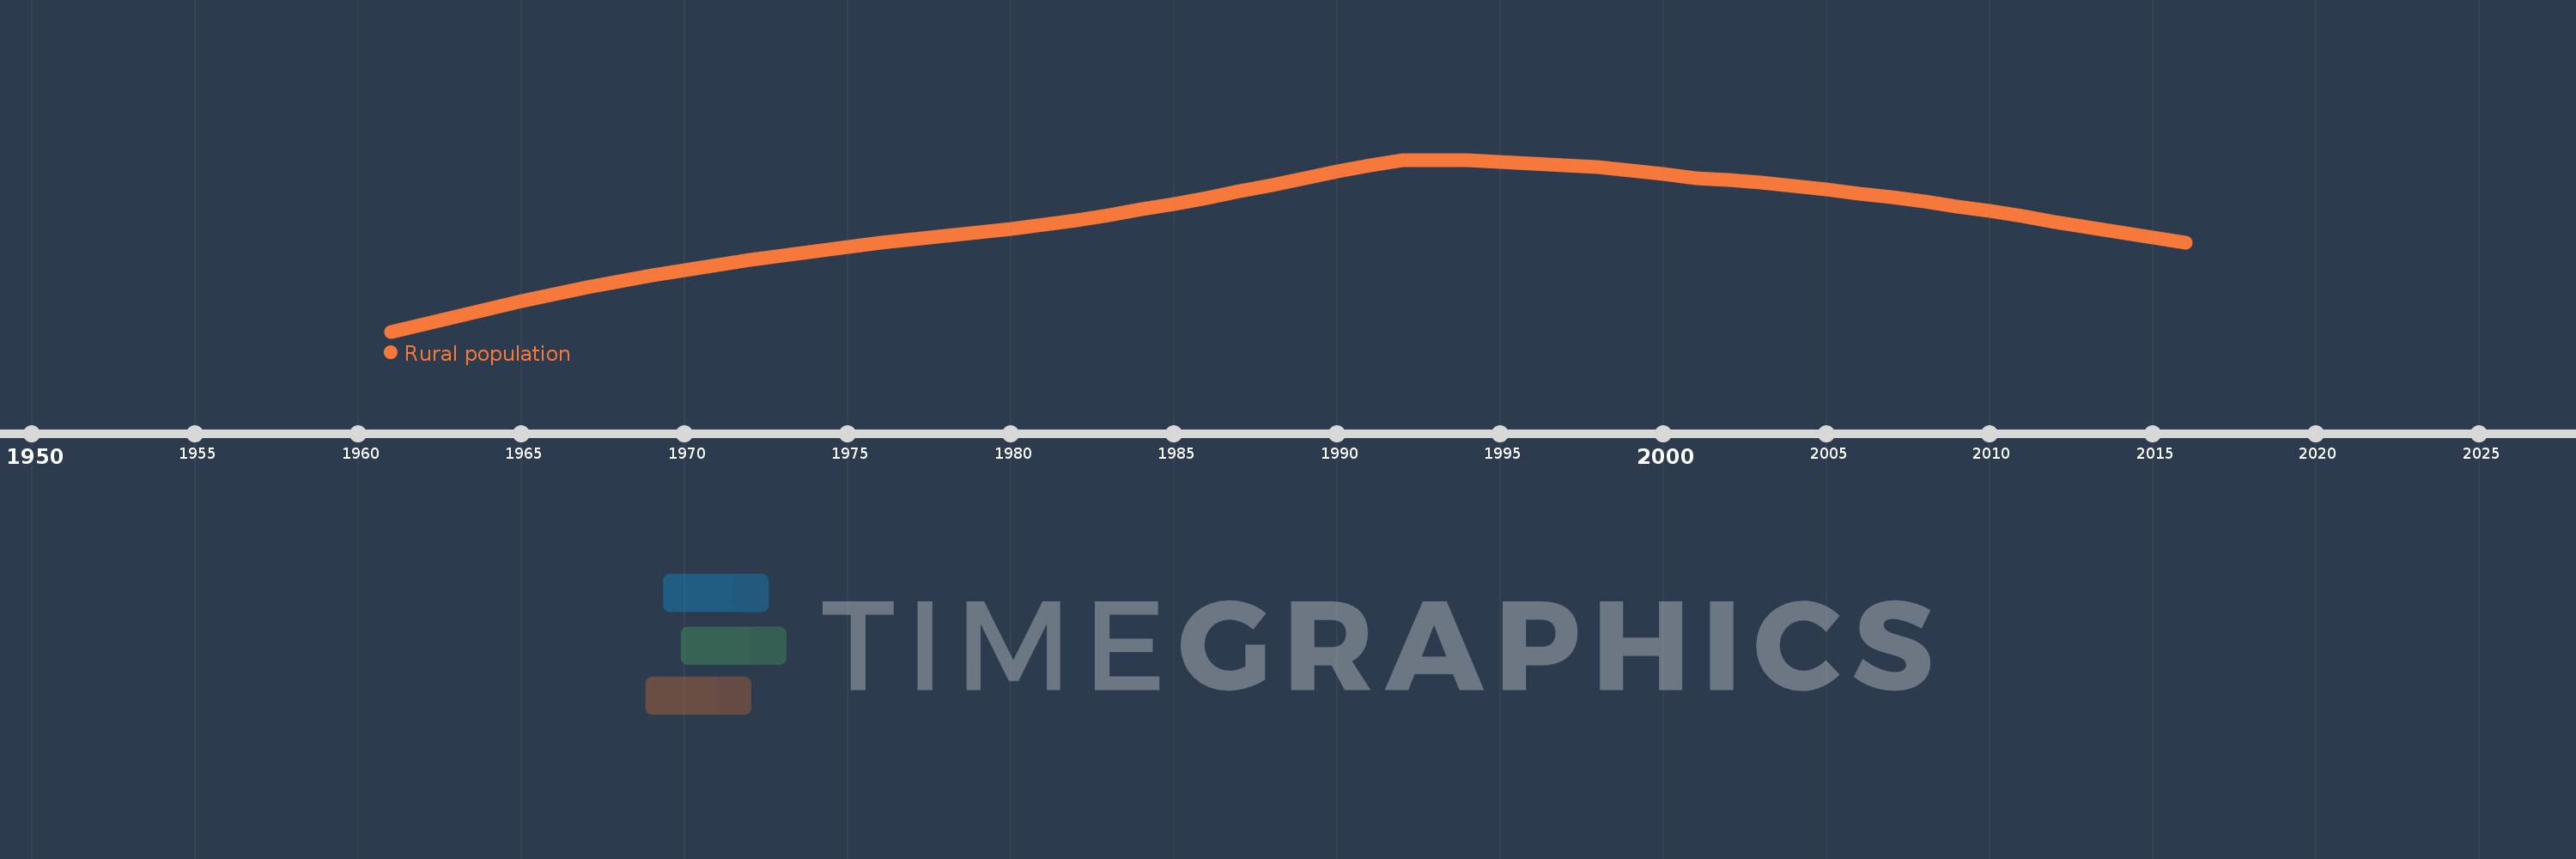
Rural population
2016,2015,2014,2013,2012,2011,2010,2009,2008,2007,2006,2005,2004,2003,2002,2001,2000,1999,1998,1997,1996,1995,1994,1993,1992,1991,1990,1989,1988,1987,1986,1985,1984,1983,1982,1981,1980,1979,1978,1977,1976,1975,1974,1973,1972,1971,1970,1969,1968,1967,1966,1965,1964,1963,1962,1961
This statistics in other country:
AfghanistanAlbaniaAlgeriaAmerican SamoaAndorraAngolaAntigua and BarbudaArab WorldArgentinaArmeniaArubaAustraliaAustriaAzerbaijanBahamas, TheBahrainBangladeshBarbadosBelarusBelgiumBelizeBeninBermudaBhutanBoliviaBosnia and HerzegovinaBotswanaBrazilBritish Virgin IslandsBrunei DarussalamBulgariaBurkina FasoBurundiCabo VerdeCambodiaCameroonCanadaCaribbean small statesCayman IslandsCentral African RepublicCentral Europe and the BalticsChadChannel IslandsChileChinaColombiaComorosCongo, Dem. Rep.Congo, Rep.Costa RicaCote d'IvoireCroatiaCubaCuracaoCyprusCzech RepublicDenmarkDjiboutiDominicaDominican RepublicEarly-demographic dividendEast Asia & PacificEast Asia & Pacific (excluding high income)East Asia & Pacific (IDA & IBRD countries)EcuadorEgypt, Arab Rep.El SalvadorEquatorial GuineaEritreaEstoniaEthiopiaEuro areaEurope & Central AsiaEurope & Central Asia (excluding high income)Europe & Central Asia (IDA & IBRD countries)European UnionFaroe IslandsFijiFinlandFragile and conflict affected situationsFranceFrench PolynesiaGabonGambia, TheGeorgiaGermanyGhanaGibraltarGreeceGreenlandGrenadaGuamGuatemalaGuineaGuinea-BissauGuyanaHaitiHeavily indebted poor countries (HIPC)High incomeHondurasHong Kong SAR, ChinaHungaryIBRD onlyIcelandIDA & IBRD totalIDA blendIDA onlyIDA totalIndiaIndonesiaIran, Islamic Rep.IraqIrelandIsle of ManIsraelItalyJamaicaJapanJordanKazakhstanKenyaKiribatiKorea, Dem. People’s Rep.Korea, Rep.KuwaitKyrgyz RepublicLao PDRLate-demographic dividendLatin America & Caribbean Latin America & Caribbean (excluding high income)Latin America & the Caribbean (IDA & IBRD countries)LatviaLeast developed countries: UN classificationLebanonLesothoLiberiaLibyaLiechtensteinLithuaniaLow & middle incomeLow incomeLower middle incomeLuxembourgMacao SAR, ChinaMacedonia, FYRMadagascarMalawiMalaysiaMaldivesMaliMaltaMarshall IslandsMauritaniaMauritiusMexicoMicronesia, Fed. Sts.Middle East & North AfricaMiddle East & North Africa (excluding high income)Middle East & North Africa (IDA & IBRD countries)Middle incomeMoldovaMonacoMongoliaMontenegroMoroccoMozambiqueMyanmarNamibiaNauruNepalNetherlandsNew CaledoniaNew ZealandNicaraguaNigerNigeriaNorth AmericaNorthern Mariana IslandsNorwayOECD membersOmanOther small statesPacific island small statesPakistanPalauPanamaPapua New GuineaParaguayPeruPhilippinesPolandPortugalPost-demographic dividendPre-demographic dividendPuerto RicoQatarRomaniaRussian FederationRwandaSamoaSan MarinoSao Tome and PrincipeSaudi ArabiaSenegalSerbiaSeychellesSierra LeoneSingaporeSint Maarten (Dutch part)Slovak RepublicSloveniaSmall statesSolomon IslandsSomaliaSouth AfricaSouth AsiaSouth Asia (IDA & IBRD)South SudanSpainSri LankaSt. Kitts and NevisSt. LuciaSt. Vincent and the GrenadinesSub-Saharan Africa Sub-Saharan Africa (excluding high income)Sub-Saharan Africa (IDA & IBRD countries)SudanSurinameSwazilandSwedenSwitzerlandSyrian Arab RepublicTajikistanTanzaniaThailandTimor-LesteTogoTongaTrinidad and TobagoTunisiaTurkeyTurkmenistanTurks and Caicos IslandsTuvaluUgandaUkraineUnited Arab EmiratesUnited KingdomUnited StatesUpper middle incomeUruguayUzbekistanVanuatuVenezuela, RBVietnamVirgin Islands (U.S.)West Bank and GazaWorldYemen, Rep.ZambiaZimbabwe Timeline:
This timeline shows a graph from 1961 to 2016 of Malaysia. No data until 1960. Number of actual observations by date: 56.
Source name:
World Development Indicators
Source organization:
The data on urban population shares used to estimate rural population come from the United Nations, World Urbanization Prospects. Total population figures are World Bank estimates.
Categories, topics:
Agriculture & Rural Development
Last updated:
apr 23, 2017
Indicators value changes by year
Minimum:
5.99 mln
jan 1, 1961
Maximum:
9.254 mln
jan 1, 1993
At the date of observation
Value
Absolute change
Change from previous value
jan 1, 1961
5.99 mln
+5.99 mln
0.0%
jan 1, 1962
6.133 mln
+142.806K
2.38%
jan 1, 1963
6.281 mln
+147.709K
2.41%
jan 1, 1964
6.429 mln
+148.408K
2.36%
jan 1, 1965
6.573 mln
+143.295K
2.23%
jan 1, 1966
6.707 mln
+134.638K
2.05%
jan 1, 1967
6.831 mln
+124.248K
1.85%
jan 1, 1968
6.946 mln
+115.062K
1.68%
jan 1, 1969
7.054 mln
+107.762K
1.55%
jan 1, 1970
7.158 mln
+103.621K
1.47%
jan 1, 1971
7.259 mln
+101.392K
1.42%
jan 1, 1972
7.35 mln
+90.608K
1.25%
jan 1, 1973
7.437 mln
+87.266K
1.19%
jan 1, 1974
7.521 mln
+84.225K
1.13%
jan 1, 1975
7.601 mln
+79.75K
1.06%
jan 1, 1976
7.676 mln
+75.041K
0.99%
jan 1, 1977
7.746 mln
+70.244K
0.92%
jan 1, 1978
7.814 mln
+67.146K
0.87%
jan 1, 1979
7.879 mln
+65.73K
0.84%
jan 1, 1980
7.946 mln
+67.008K
0.85%
jan 1, 1981
8.017 mln
+71.204K
0.9%
jan 1, 1982
8.11 mln
+92.539K
1.15%
jan 1, 1983
8.206 mln
+96.342K
1.19%
jan 1, 1984
8.308 mln
+101.245K
1.23%
jan 1, 1985
8.415 mln
+107.498K
1.29%
jan 1, 1986
8.53 mln
+114.505K
1.36%
jan 1, 1987
8.651 mln
+121.295K
1.42%
jan 1, 1988
8.778 mln
+126.783K
1.47%
jan 1, 1989
8.905 mln
+127.459K
1.45%
jan 1, 1990
9.028 mln
+123.33K
1.38%
jan 1, 1991
9.143 mln
+114.585K
1.27%
jan 1, 1992
9.247 mln
+104.086K
1.14%
jan 1, 1993
9.254 mln
+6.828K
0.07%
jan 1, 1994
9.238 mln
-16.093K
-0.17%
jan 1, 1995
9.214 mln
-24.356K
-0.26%
jan 1, 1996
9.184 mln
-29.7K
-0.32%
jan 1, 1997
9.149 mln
-35.058K
-0.38%
jan 1, 1998
9.108 mln
-41.043K
-0.45%
jan 1, 1999
9.056 mln
-51.791K
-0.57%
jan 1, 2000
8.99 mln
-66.412K
-0.73%
jan 1, 2001
8.905 mln
-84.252K
-0.94%
jan 1, 2002
8.869 mln
-35.857K
-0.4%
jan 1, 2003
8.82 mln
-49.564K
-0.56%
jan 1, 2004
8.759 mln
-60.84K
-0.69%
jan 1, 2005
8.69 mln
-68.606K
-0.78%
jan 1, 2006
8.617 mln
-72.952K
-0.84%
jan 1, 2007
8.54 mln
-77.498K
-0.9%
jan 1, 2008
8.458 mln
-82.391K
-0.96%
jan 1, 2009
8.37 mln
-87.558K
-1.04%
jan 1, 2010
8.278 mln
-92.447K
-1.1%
jan 1, 2011
8.179 mln
-98.159K
-1.19%
jan 1, 2012
8.076 mln
-103.25K
-1.26%
jan 1, 2013
7.973 mln
-102.662K
-1.27%
jan 1, 2014
7.872 mln
-101.519K
-1.27%
jan 1, 2015
7.772 mln
-100.44K
-1.28%
jan 1, 2016
7.672 mln
-99.301K
-1.28%
Ranking of countries by current statistics by years


Comments: