29
/
en
AIzaSyAYiBZKx7MnpbEhh9jyipgxe19OcubqV5w
April 1, 2024
37766
IDA & IBRD total
IBT
false
2
1
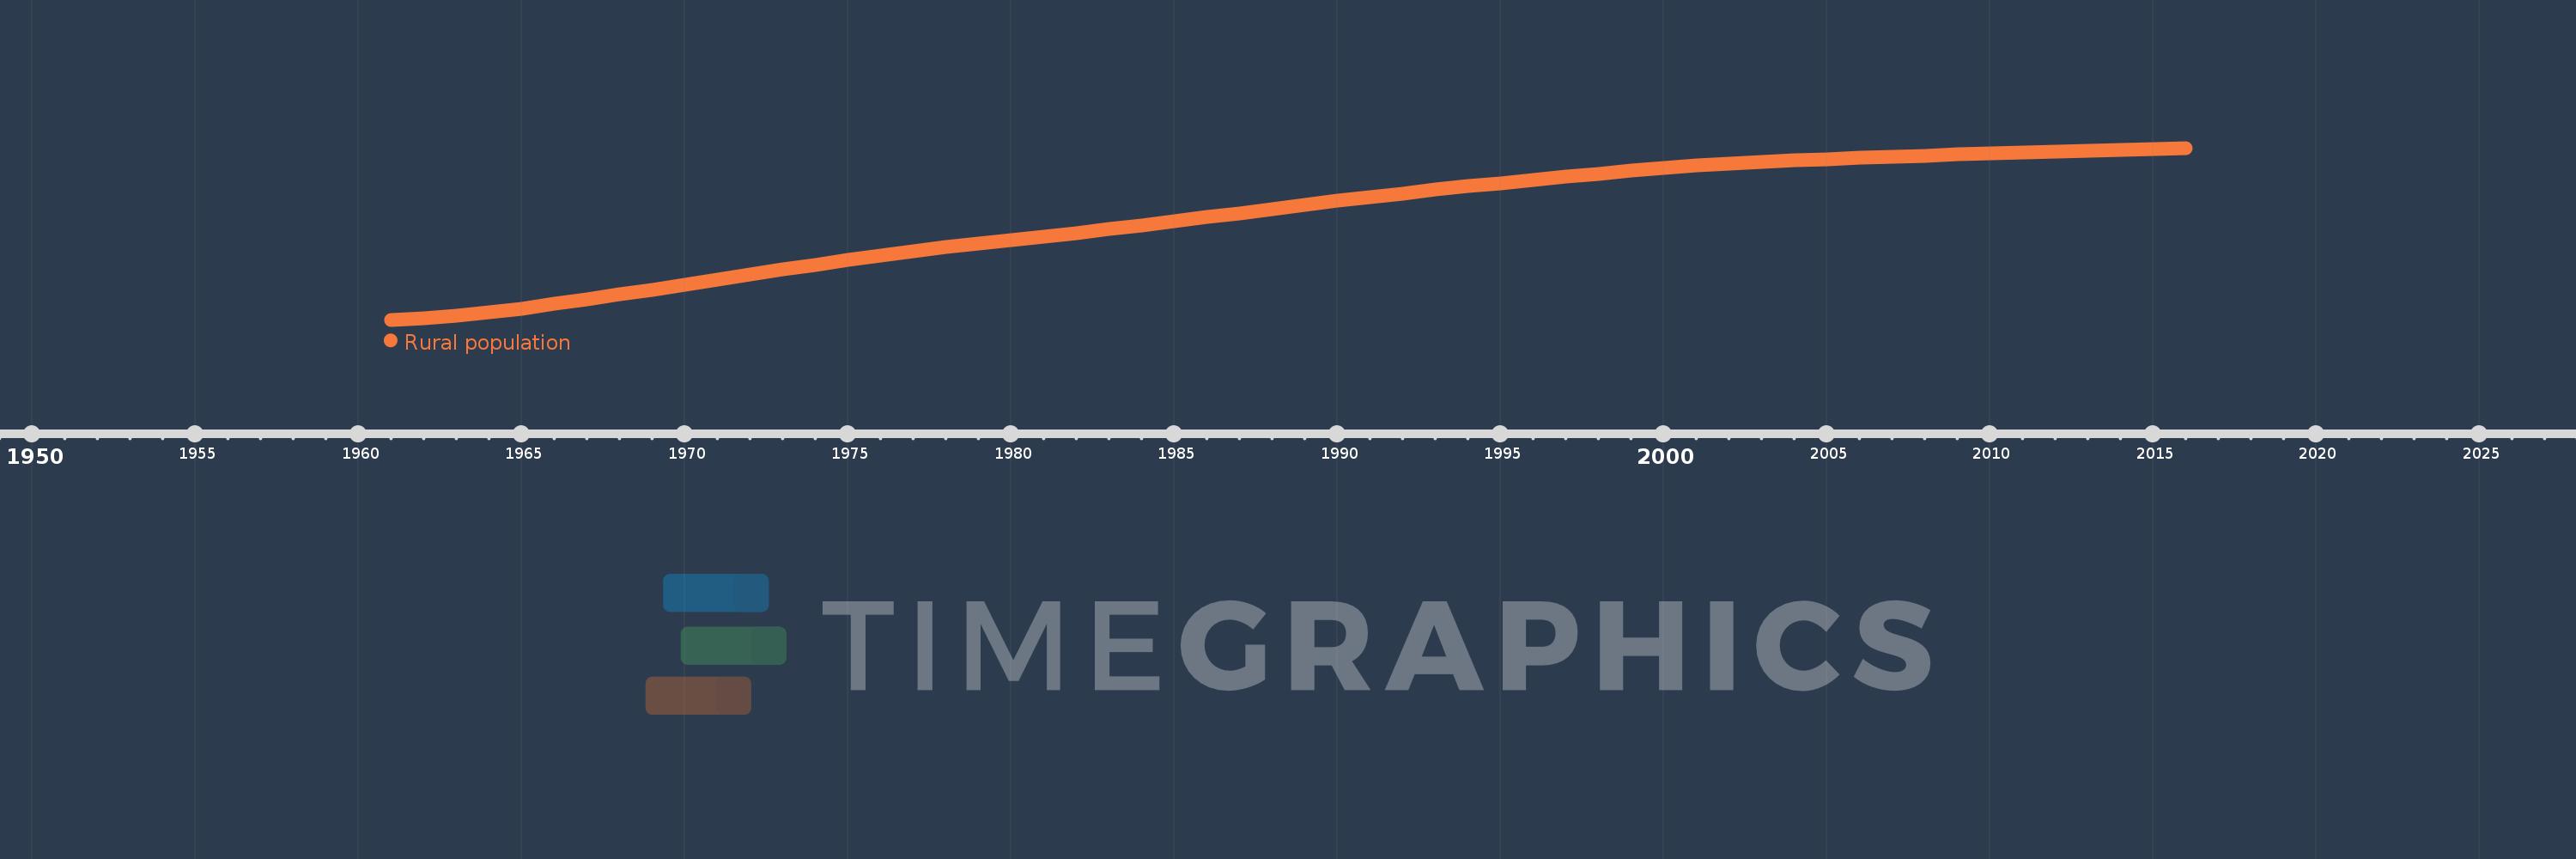
Rural population
2016,2015,2014,2013,2012,2011,2010,2009,2008,2007,2006,2005,2004,2003,2002,2001,2000,1999,1998,1997,1996,1995,1994,1993,1992,1991,1990,1989,1988,1987,1986,1985,1984,1983,1982,1981,1980,1979,1978,1977,1976,1975,1974,1973,1972,1971,1970,1969,1968,1967,1966,1965,1964,1963,1962,1961
This statistics in other country:
AfghanistanAlbaniaAlgeriaAmerican SamoaAndorraAngolaAntigua and BarbudaArab WorldArgentinaArmeniaArubaAustraliaAustriaAzerbaijanBahamas, TheBahrainBangladeshBarbadosBelarusBelgiumBelizeBeninBermudaBhutanBoliviaBosnia and HerzegovinaBotswanaBrazilBritish Virgin IslandsBrunei DarussalamBulgariaBurkina FasoBurundiCabo VerdeCambodiaCameroonCanadaCaribbean small statesCayman IslandsCentral African RepublicCentral Europe and the BalticsChadChannel IslandsChileChinaColombiaComorosCongo, Dem. Rep.Congo, Rep.Costa RicaCote d'IvoireCroatiaCubaCuracaoCyprusCzech RepublicDenmarkDjiboutiDominicaDominican RepublicEarly-demographic dividendEast Asia & PacificEast Asia & Pacific (excluding high income)East Asia & Pacific (IDA & IBRD countries)EcuadorEgypt, Arab Rep.El SalvadorEquatorial GuineaEritreaEstoniaEthiopiaEuro areaEurope & Central AsiaEurope & Central Asia (excluding high income)Europe & Central Asia (IDA & IBRD countries)European UnionFaroe IslandsFijiFinlandFragile and conflict affected situationsFranceFrench PolynesiaGabonGambia, TheGeorgiaGermanyGhanaGibraltarGreeceGreenlandGrenadaGuamGuatemalaGuineaGuinea-BissauGuyanaHaitiHeavily indebted poor countries (HIPC)High incomeHondurasHong Kong SAR, ChinaHungaryIBRD onlyIcelandIDA & IBRD totalIDA blendIDA onlyIDA totalIndiaIndonesiaIran, Islamic Rep.IraqIrelandIsle of ManIsraelItalyJamaicaJapanJordanKazakhstanKenyaKiribatiKorea, Dem. People’s Rep.Korea, Rep.KuwaitKyrgyz RepublicLao PDRLate-demographic dividendLatin America & Caribbean Latin America & Caribbean (excluding high income)Latin America & the Caribbean (IDA & IBRD countries)LatviaLeast developed countries: UN classificationLebanonLesothoLiberiaLibyaLiechtensteinLithuaniaLow & middle incomeLow incomeLower middle incomeLuxembourgMacao SAR, ChinaMacedonia, FYRMadagascarMalawiMalaysiaMaldivesMaliMaltaMarshall IslandsMauritaniaMauritiusMexicoMicronesia, Fed. Sts.Middle East & North AfricaMiddle East & North Africa (excluding high income)Middle East & North Africa (IDA & IBRD countries)Middle incomeMoldovaMonacoMongoliaMontenegroMoroccoMozambiqueMyanmarNamibiaNauruNepalNetherlandsNew CaledoniaNew ZealandNicaraguaNigerNigeriaNorth AmericaNorthern Mariana IslandsNorwayOECD membersOmanOther small statesPacific island small statesPakistanPalauPanamaPapua New GuineaParaguayPeruPhilippinesPolandPortugalPost-demographic dividendPre-demographic dividendPuerto RicoQatarRomaniaRussian FederationRwandaSamoaSan MarinoSao Tome and PrincipeSaudi ArabiaSenegalSerbiaSeychellesSierra LeoneSingaporeSint Maarten (Dutch part)Slovak RepublicSloveniaSmall statesSolomon IslandsSomaliaSouth AfricaSouth AsiaSouth Asia (IDA & IBRD)South SudanSpainSri LankaSt. Kitts and NevisSt. LuciaSt. Vincent and the GrenadinesSub-Saharan Africa Sub-Saharan Africa (excluding high income)Sub-Saharan Africa (IDA & IBRD countries)SudanSurinameSwazilandSwedenSwitzerlandSyrian Arab RepublicTajikistanTanzaniaThailandTimor-LesteTogoTongaTrinidad and TobagoTunisiaTurkeyTurkmenistanTurks and Caicos IslandsTuvaluUgandaUkraineUnited Arab EmiratesUnited KingdomUnited StatesUpper middle incomeUruguayUzbekistanVanuatuVenezuela, RBVietnamVirgin Islands (U.S.)West Bank and GazaWorldYemen, Rep.ZambiaZimbabwe Timeline:
This timeline shows a graph from 1961 to 2016 of IDA & IBRD total. No data until 1960. Number of actual observations by date: 56.
Source name:
World Development Indicators
Source organization:
The data on urban population shares used to estimate rural population come from the United Nations, World Urbanization Prospects. Total population figures are World Bank estimates.
Categories, topics:
Agriculture & Rural Development
Last updated:
apr 23, 2017
Indicators value changes by year
Minimum:
1.751 bln
jan 1, 1961
Maximum:
3.165 bln
jan 1, 2016
At the date of observation
Value
Absolute change
Change from previous value
jan 1, 1961
1.751 bln
+1.751 bln
0.0%
jan 1, 1962
1.762 bln
+10.929 mln
0.62%
jan 1, 1963
1.783 bln
+21.21 mln
1.2%
jan 1, 1964
1.813 bln
+30.54 mln
1.71%
jan 1, 1965
1.844 bln
+30.342 mln
1.67%
jan 1, 1966
1.88 bln
+36.499 mln
1.98%
jan 1, 1967
1.919 bln
+39.208 mln
2.09%
jan 1, 1968
1.958 bln
+38.604 mln
2.01%
jan 1, 1969
1.998 bln
+39.619 mln
2.02%
jan 1, 1970
2.039 bln
+41.2 mln
2.06%
jan 1, 1971
2.081 bln
+42.107 mln
2.07%
jan 1, 1972
2.123 bln
+42.421 mln
2.04%
jan 1, 1973
2.164 bln
+40.653 mln
1.91%
jan 1, 1974
2.203 bln
+39.177 mln
1.81%
jan 1, 1975
2.24 bln
+37.288 mln
1.69%
jan 1, 1976
2.278 bln
+37.668 mln
1.68%
jan 1, 1977
2.313 bln
+35.169 mln
1.54%
jan 1, 1978
2.347 bln
+34.231 mln
1.48%
jan 1, 1979
2.379 bln
+31.365 mln
1.34%
jan 1, 1980
2.408 bln
+28.999 mln
1.22%
jan 1, 1981
2.437 bln
+28.722 mln
1.19%
jan 1, 1982
2.465 bln
+28.782 mln
1.18%
jan 1, 1983
2.497 bln
+31.551 mln
1.28%
jan 1, 1984
2.53 bln
+32.948 mln
1.32%
jan 1, 1985
2.562 bln
+31.773 mln
1.26%
jan 1, 1986
2.594 bln
+32.089 mln
1.25%
jan 1, 1987
2.627 bln
+33.145 mln
1.28%
jan 1, 1988
2.661 bln
+34.112 mln
1.3%
jan 1, 1989
2.695 bln
+33.874 mln
1.27%
jan 1, 1990
2.728 bln
+33.387 mln
1.24%
jan 1, 1991
2.761 bln
+32.33 mln
1.19%
jan 1, 1992
2.791 bln
+30.716 mln
1.11%
jan 1, 1993
2.821 bln
+29.29 mln
1.05%
jan 1, 1994
2.849 bln
+28.13 mln
1.0%
jan 1, 1995
2.876 bln
+27.376 mln
0.96%
jan 1, 1996
2.903 bln
+26.525 mln
0.92%
jan 1, 1997
2.928 bln
+25.654 mln
0.88%
jan 1, 1998
2.953 bln
+24.87 mln
0.85%
jan 1, 1999
2.977 bln
+23.637 mln
0.8%
jan 1, 2000
2.999 bln
+22.256 mln
0.75%
jan 1, 2001
3.019 bln
+20.45 mln
0.68%
jan 1, 2002
3.036 bln
+16.943 mln
0.56%
jan 1, 2003
3.05 bln
+13.282 mln
0.44%
jan 1, 2004
3.062 bln
+12.201 mln
0.4%
jan 1, 2005
3.073 bln
+11.167 mln
0.36%
jan 1, 2006
3.083 bln
+10.297 mln
0.34%
jan 1, 2007
3.093 bln
+9.825 mln
0.32%
jan 1, 2008
3.102 bln
+9.127 mln
0.3%
jan 1, 2009
3.111 bln
+8.452 mln
0.27%
jan 1, 2010
3.119 bln
+8.241 mln
0.26%
jan 1, 2011
3.127 bln
+7.817 mln
0.25%
jan 1, 2012
3.134 bln
+7.57 mln
0.24%
jan 1, 2013
3.142 bln
+7.545 mln
0.24%
jan 1, 2014
3.15 bln
+7.708 mln
0.25%
jan 1, 2015
3.157 bln
+7.792 mln
0.25%
jan 1, 2016
3.165 bln
+7.689 mln
0.24%
Ranking of countries by current statistics by years


Comments: