29
/
en
AIzaSyAYiBZKx7MnpbEhh9jyipgxe19OcubqV5w
April 1, 2024
120446
Djibouti
DJI
true
2
1
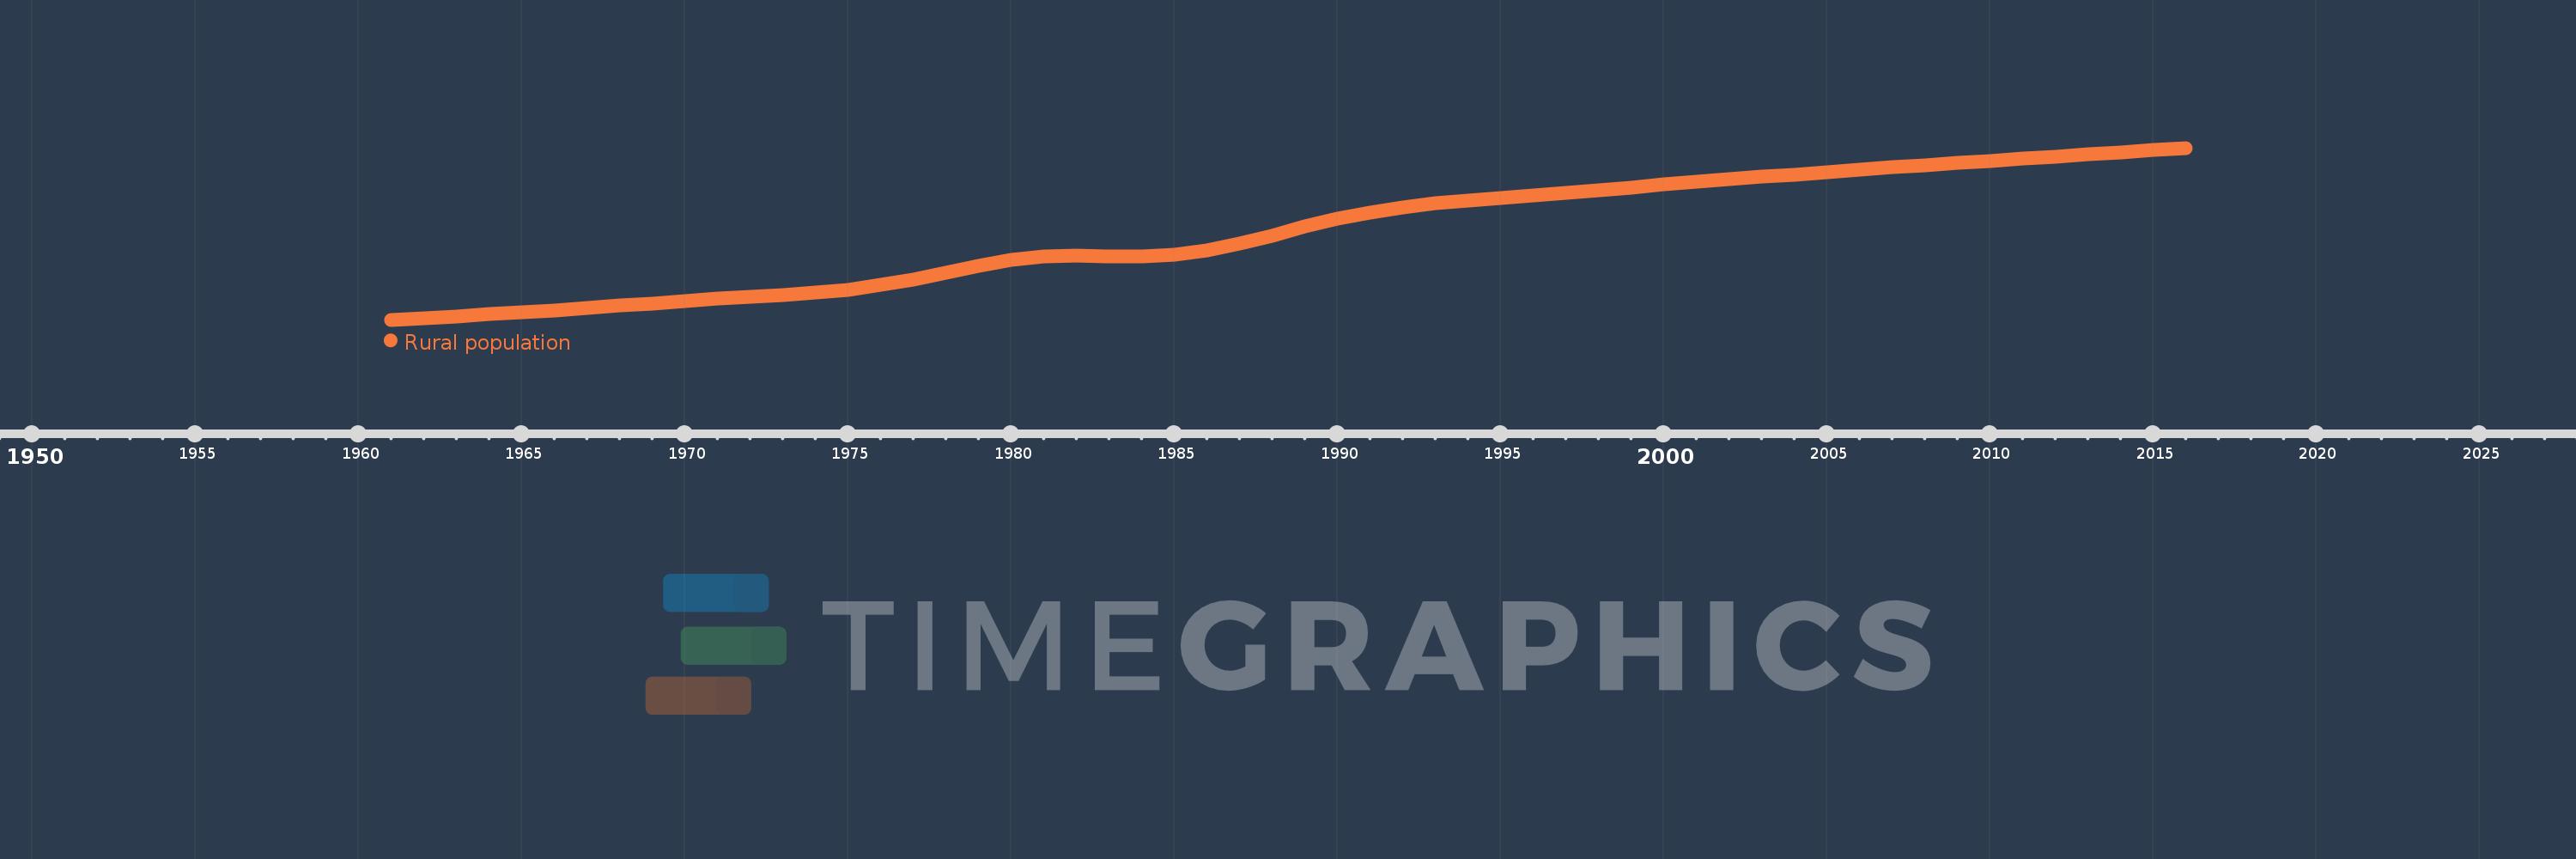
Rural population
2016,2015,2014,2013,2012,2011,2010,2009,2008,2007,2006,2005,2004,2003,2002,2001,2000,1999,1998,1997,1996,1995,1994,1993,1992,1991,1990,1989,1988,1987,1986,1985,1984,1983,1982,1981,1980,1979,1978,1977,1976,1975,1974,1973,1972,1971,1970,1969,1968,1967,1966,1965,1964,1963,1962,1961
This statistics in other country:
AfghanistanAlbaniaAlgeriaAmerican SamoaAndorraAngolaAntigua and BarbudaArab WorldArgentinaArmeniaArubaAustraliaAustriaAzerbaijanBahamas, TheBahrainBangladeshBarbadosBelarusBelgiumBelizeBeninBermudaBhutanBoliviaBosnia and HerzegovinaBotswanaBrazilBritish Virgin IslandsBrunei DarussalamBulgariaBurkina FasoBurundiCabo VerdeCambodiaCameroonCanadaCaribbean small statesCayman IslandsCentral African RepublicCentral Europe and the BalticsChadChannel IslandsChileChinaColombiaComorosCongo, Dem. Rep.Congo, Rep.Costa RicaCote d'IvoireCroatiaCubaCuracaoCyprusCzech RepublicDenmarkDjiboutiDominicaDominican RepublicEarly-demographic dividendEast Asia & PacificEast Asia & Pacific (excluding high income)East Asia & Pacific (IDA & IBRD countries)EcuadorEgypt, Arab Rep.El SalvadorEquatorial GuineaEritreaEstoniaEthiopiaEuro areaEurope & Central AsiaEurope & Central Asia (excluding high income)Europe & Central Asia (IDA & IBRD countries)European UnionFaroe IslandsFijiFinlandFragile and conflict affected situationsFranceFrench PolynesiaGabonGambia, TheGeorgiaGermanyGhanaGibraltarGreeceGreenlandGrenadaGuamGuatemalaGuineaGuinea-BissauGuyanaHaitiHeavily indebted poor countries (HIPC)High incomeHondurasHong Kong SAR, ChinaHungaryIBRD onlyIcelandIDA & IBRD totalIDA blendIDA onlyIDA totalIndiaIndonesiaIran, Islamic Rep.IraqIrelandIsle of ManIsraelItalyJamaicaJapanJordanKazakhstanKenyaKiribatiKorea, Dem. People’s Rep.Korea, Rep.KuwaitKyrgyz RepublicLao PDRLate-demographic dividendLatin America & Caribbean Latin America & Caribbean (excluding high income)Latin America & the Caribbean (IDA & IBRD countries)LatviaLeast developed countries: UN classificationLebanonLesothoLiberiaLibyaLiechtensteinLithuaniaLow & middle incomeLow incomeLower middle incomeLuxembourgMacao SAR, ChinaMacedonia, FYRMadagascarMalawiMalaysiaMaldivesMaliMaltaMarshall IslandsMauritaniaMauritiusMexicoMicronesia, Fed. Sts.Middle East & North AfricaMiddle East & North Africa (excluding high income)Middle East & North Africa (IDA & IBRD countries)Middle incomeMoldovaMonacoMongoliaMontenegroMoroccoMozambiqueMyanmarNamibiaNauruNepalNetherlandsNew CaledoniaNew ZealandNicaraguaNigerNigeriaNorth AmericaNorthern Mariana IslandsNorwayOECD membersOmanOther small statesPacific island small statesPakistanPalauPanamaPapua New GuineaParaguayPeruPhilippinesPolandPortugalPost-demographic dividendPre-demographic dividendPuerto RicoQatarRomaniaRussian FederationRwandaSamoaSan MarinoSao Tome and PrincipeSaudi ArabiaSenegalSerbiaSeychellesSierra LeoneSingaporeSint Maarten (Dutch part)Slovak RepublicSloveniaSmall statesSolomon IslandsSomaliaSouth AfricaSouth AsiaSouth Asia (IDA & IBRD)South SudanSpainSri LankaSt. Kitts and NevisSt. LuciaSt. Vincent and the GrenadinesSub-Saharan Africa Sub-Saharan Africa (excluding high income)Sub-Saharan Africa (IDA & IBRD countries)SudanSurinameSwazilandSwedenSwitzerlandSyrian Arab RepublicTajikistanTanzaniaThailandTimor-LesteTogoTongaTrinidad and TobagoTunisiaTurkeyTurkmenistanTurks and Caicos IslandsTuvaluUgandaUkraineUnited Arab EmiratesUnited KingdomUnited StatesUpper middle incomeUruguayUzbekistanVanuatuVenezuela, RBVietnamVirgin Islands (U.S.)West Bank and GazaWorldYemen, Rep.ZambiaZimbabwe Timeline:
This timeline shows a graph from 1961 to 2016 of Djibouti. No data until 1960. Number of actual observations by date: 56.
Source name:
World Development Indicators
Source organization:
The data on urban population shares used to estimate rural population come from the United Nations, World Urbanization Prospects. Total population figures are World Bank estimates.
Categories, topics:
Agriculture & Rural Development
Last updated:
apr 23, 2017
Indicators value changes by year
Minimum:
41.546K
jan 1, 1961
Maximum:
201.163K
jan 1, 2016
At the date of observation
Value
Absolute change
Change from previous value
jan 1, 1961
41.546K
+41.546K
0.0%
jan 1, 1962
42.968K
+1.422K
3.42%
jan 1, 1963
44.633K
+1.665K
3.87%
jan 1, 1964
46.5K
+1.867K
4.18%
jan 1, 1965
48.464K
+1.964K
4.22%
jan 1, 1966
50.458K
+1.994K
4.11%
jan 1, 1967
52.514K
+2.056K
4.07%
jan 1, 1968
54.658K
+2.144K
4.08%
jan 1, 1969
56.831K
+2.173K
3.98%
jan 1, 1970
58.961K
+2.13K
3.75%
jan 1, 1971
61.03K
+2.069K
3.51%
jan 1, 1972
62.874K
+1.844K
3.02%
jan 1, 1973
64.574K
+1.7K
2.7%
jan 1, 1974
66.611K
+2.037K
3.15%
jan 1, 1975
69.55K
+2.939K
4.41%
jan 1, 1976
73.662K
+4.112K
5.91%
jan 1, 1977
79.135K
+5.473K
7.43%
jan 1, 1978
85.569K
+6.434K
8.13%
jan 1, 1979
91.943K
+6.374K
7.45%
jan 1, 1980
97.04K
+5.097K
5.54%
jan 1, 1981
100.164K
+3.124K
3.22%
jan 1, 1982
101.059K
+895.0
0.89%
jan 1, 1983
100.256K
-803.0
-0.79%
jan 1, 1984
100.176K
-80.0
-0.08%
jan 1, 1985
102.3K
+2.124K
2.12%
jan 1, 1986
106.185K
+3.885K
3.8%
jan 1, 1987
112.163K
+5.978K
5.63%
jan 1, 1988
119.735K
+7.572K
6.75%
jan 1, 1989
127.949K
+8.214K
6.86%
jan 1, 1990
135.495K
+7.546K
5.9%
jan 1, 1991
141.458K
+5.963K
4.4%
jan 1, 1992
145.867K
+4.409K
3.12%
jan 1, 1993
149.486K
+3.619K
2.48%
jan 1, 1994
152.088K
+2.602K
1.74%
jan 1, 1995
154.32K
+2.232K
1.47%
jan 1, 1996
156.675K
+2.355K
1.53%
jan 1, 1997
159.232K
+2.557K
1.63%
jan 1, 1998
161.86K
+2.628K
1.65%
jan 1, 1999
164.516K
+2.656K
1.64%
jan 1, 2000
167.11K
+2.594K
1.58%
jan 1, 2001
169.571K
+2.461K
1.47%
jan 1, 2002
171.938K
+2.367K
1.4%
jan 1, 2003
174.258K
+2.32K
1.35%
jan 1, 2004
176.528K
+2.27K
1.3%
jan 1, 2005
178.738K
+2.21K
1.25%
jan 1, 2006
180.894K
+2.156K
1.21%
jan 1, 2007
182.979K
+2.085K
1.15%
jan 1, 2008
185.016K
+2.037K
1.11%
jan 1, 2009
187.035K
+2.019K
1.09%
jan 1, 2010
189.082K
+2.047K
1.09%
jan 1, 2011
191.118K
+2.036K
1.08%
jan 1, 2012
193.168K
+2.05K
1.07%
jan 1, 2013
195.208K
+2.04K
1.06%
jan 1, 2014
197.239K
+2.031K
1.04%
jan 1, 2015
199.224K
+1.985K
1.01%
jan 1, 2016
201.163K
+1.939K
0.97%
Ranking of countries by current statistics by years


Comments: