29
/
en
AIzaSyAYiBZKx7MnpbEhh9jyipgxe19OcubqV5w
April 1, 2024
39524
IDA only
IDX
false
2
1
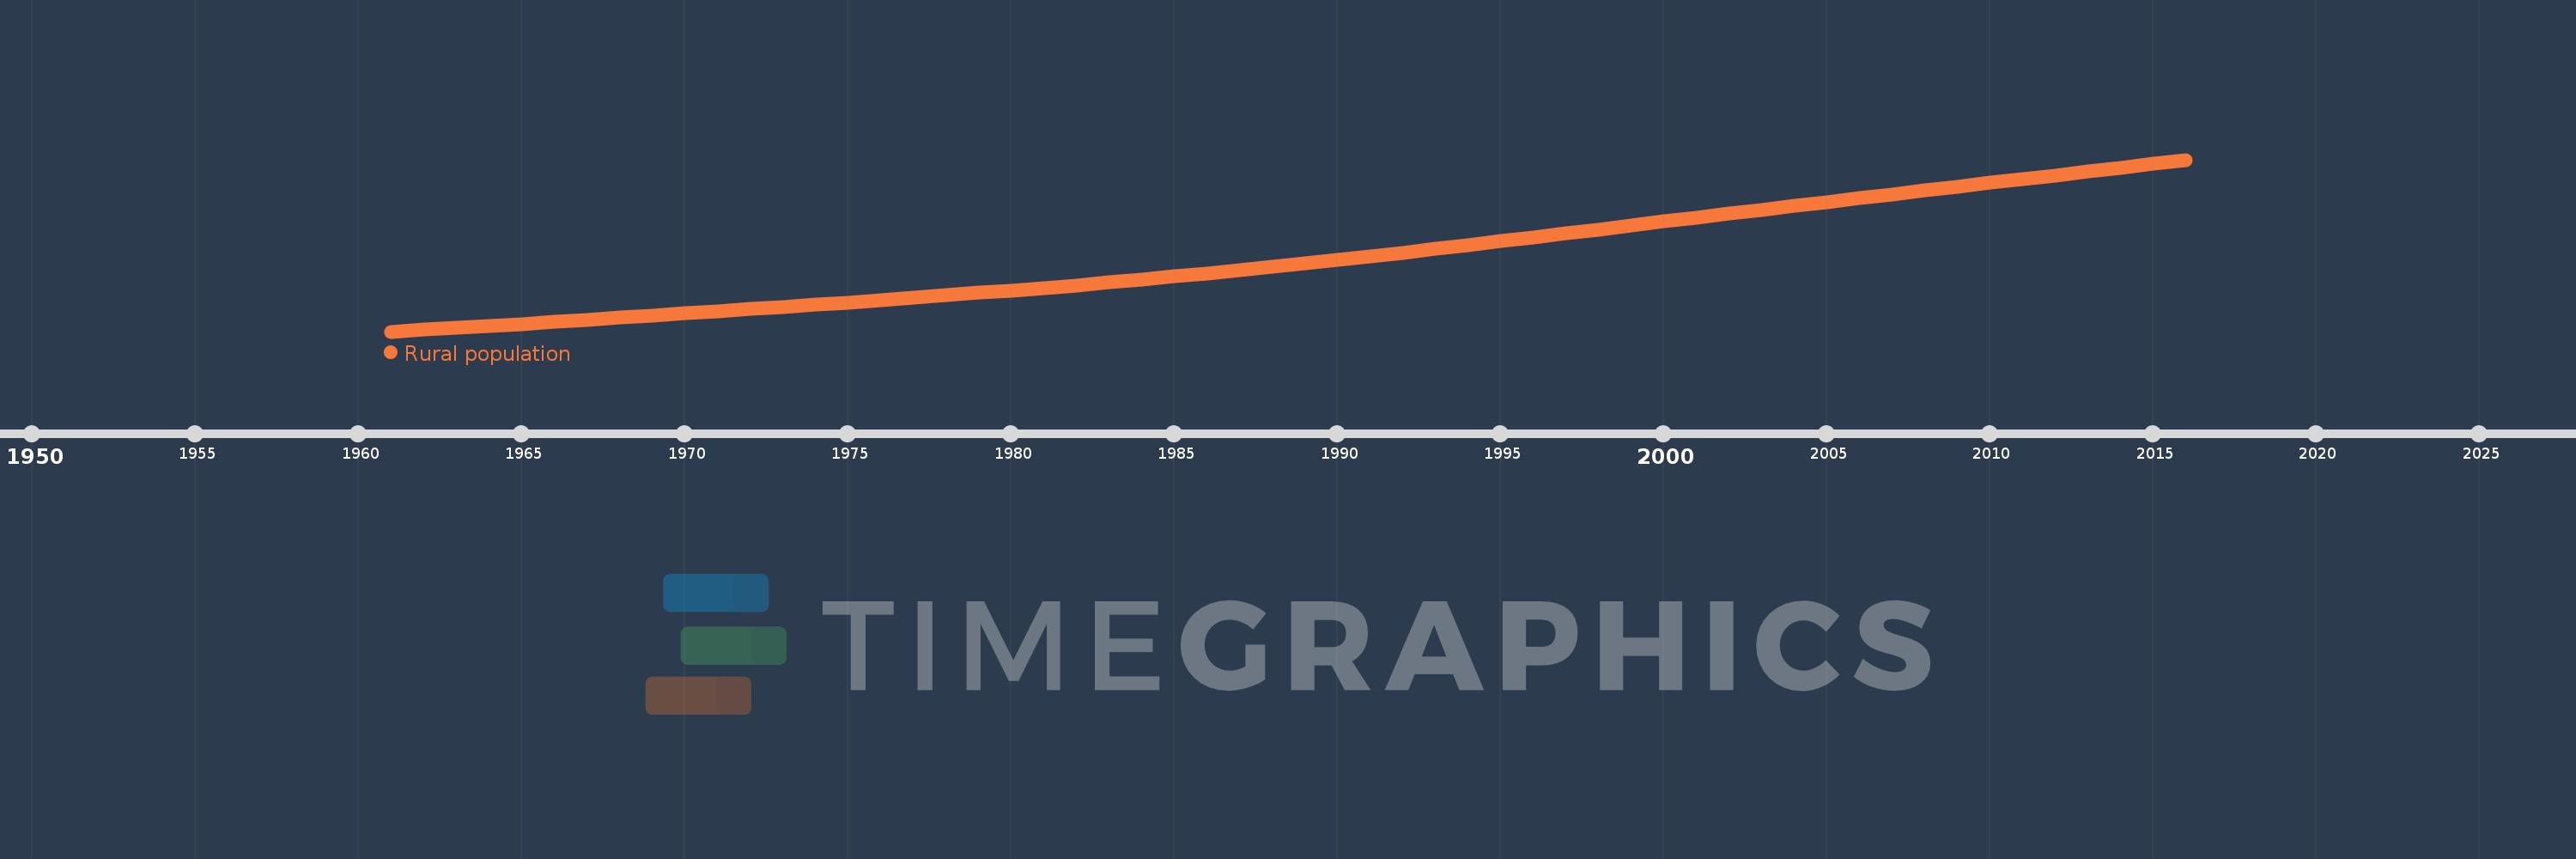
Rural population
2016,2015,2014,2013,2012,2011,2010,2009,2008,2007,2006,2005,2004,2003,2002,2001,2000,1999,1998,1997,1996,1995,1994,1993,1992,1991,1990,1989,1988,1987,1986,1985,1984,1983,1982,1981,1980,1979,1978,1977,1976,1975,1974,1973,1972,1971,1970,1969,1968,1967,1966,1965,1964,1963,1962,1961
This statistics in other country:
AfghanistanAlbaniaAlgeriaAmerican SamoaAndorraAngolaAntigua and BarbudaArab WorldArgentinaArmeniaArubaAustraliaAustriaAzerbaijanBahamas, TheBahrainBangladeshBarbadosBelarusBelgiumBelizeBeninBermudaBhutanBoliviaBosnia and HerzegovinaBotswanaBrazilBritish Virgin IslandsBrunei DarussalamBulgariaBurkina FasoBurundiCabo VerdeCambodiaCameroonCanadaCaribbean small statesCayman IslandsCentral African RepublicCentral Europe and the BalticsChadChannel IslandsChileChinaColombiaComorosCongo, Dem. Rep.Congo, Rep.Costa RicaCote d'IvoireCroatiaCubaCuracaoCyprusCzech RepublicDenmarkDjiboutiDominicaDominican RepublicEarly-demographic dividendEast Asia & PacificEast Asia & Pacific (excluding high income)East Asia & Pacific (IDA & IBRD countries)EcuadorEgypt, Arab Rep.El SalvadorEquatorial GuineaEritreaEstoniaEthiopiaEuro areaEurope & Central AsiaEurope & Central Asia (excluding high income)Europe & Central Asia (IDA & IBRD countries)European UnionFaroe IslandsFijiFinlandFragile and conflict affected situationsFranceFrench PolynesiaGabonGambia, TheGeorgiaGermanyGhanaGibraltarGreeceGreenlandGrenadaGuamGuatemalaGuineaGuinea-BissauGuyanaHaitiHeavily indebted poor countries (HIPC)High incomeHondurasHong Kong SAR, ChinaHungaryIBRD onlyIcelandIDA & IBRD totalIDA blendIDA onlyIDA totalIndiaIndonesiaIran, Islamic Rep.IraqIrelandIsle of ManIsraelItalyJamaicaJapanJordanKazakhstanKenyaKiribatiKorea, Dem. People’s Rep.Korea, Rep.KuwaitKyrgyz RepublicLao PDRLate-demographic dividendLatin America & Caribbean Latin America & Caribbean (excluding high income)Latin America & the Caribbean (IDA & IBRD countries)LatviaLeast developed countries: UN classificationLebanonLesothoLiberiaLibyaLiechtensteinLithuaniaLow & middle incomeLow incomeLower middle incomeLuxembourgMacao SAR, ChinaMacedonia, FYRMadagascarMalawiMalaysiaMaldivesMaliMaltaMarshall IslandsMauritaniaMauritiusMexicoMicronesia, Fed. Sts.Middle East & North AfricaMiddle East & North Africa (excluding high income)Middle East & North Africa (IDA & IBRD countries)Middle incomeMoldovaMonacoMongoliaMontenegroMoroccoMozambiqueMyanmarNamibiaNauruNepalNetherlandsNew CaledoniaNew ZealandNicaraguaNigerNigeriaNorth AmericaNorthern Mariana IslandsNorwayOECD membersOmanOther small statesPacific island small statesPakistanPalauPanamaPapua New GuineaParaguayPeruPhilippinesPolandPortugalPost-demographic dividendPre-demographic dividendPuerto RicoQatarRomaniaRussian FederationRwandaSamoaSan MarinoSao Tome and PrincipeSaudi ArabiaSenegalSerbiaSeychellesSierra LeoneSingaporeSint Maarten (Dutch part)Slovak RepublicSloveniaSmall statesSolomon IslandsSomaliaSouth AfricaSouth AsiaSouth Asia (IDA & IBRD)South SudanSpainSri LankaSt. Kitts and NevisSt. LuciaSt. Vincent and the GrenadinesSub-Saharan Africa Sub-Saharan Africa (excluding high income)Sub-Saharan Africa (IDA & IBRD countries)SudanSurinameSwazilandSwedenSwitzerlandSyrian Arab RepublicTajikistanTanzaniaThailandTimor-LesteTogoTongaTrinidad and TobagoTunisiaTurkeyTurkmenistanTurks and Caicos IslandsTuvaluUgandaUkraineUnited Arab EmiratesUnited KingdomUnited StatesUpper middle incomeUruguayUzbekistanVanuatuVenezuela, RBVietnamVirgin Islands (U.S.)West Bank and GazaWorldYemen, Rep.ZambiaZimbabwe Timeline:
This timeline shows a graph from 1961 to 2016 of IDA only. No data until 1960. Number of actual observations by date: 56.
Source name:
World Development Indicators
Source organization:
The data on urban population shares used to estimate rural population come from the United Nations, World Urbanization Prospects. Total population figures are World Bank estimates.
Categories, topics:
Agriculture & Rural Development
Last updated:
apr 23, 2017
Indicators value changes by year
Minimum:
237.002 mln
jan 1, 1961
Maximum:
720.331 mln
jan 1, 2016
At the date of observation
Value
Absolute change
Change from previous value
jan 1, 1961
237.002 mln
+237.002 mln
0.0%
jan 1, 1962
242.085 mln
+5.084 mln
2.15%
jan 1, 1963
247.275 mln
+5.189 mln
2.14%
jan 1, 1964
252.61 mln
+5.336 mln
2.16%
jan 1, 1965
258.123 mln
+5.512 mln
2.18%
jan 1, 1966
263.841 mln
+5.719 mln
2.22%
jan 1, 1967
269.829 mln
+5.987 mln
2.27%
jan 1, 1968
275.952 mln
+6.123 mln
2.27%
jan 1, 1969
282.176 mln
+6.224 mln
2.26%
jan 1, 1970
288.368 mln
+6.193 mln
2.19%
jan 1, 1971
294.505 mln
+6.137 mln
2.13%
jan 1, 1972
300.492 mln
+5.986 mln
2.03%
jan 1, 1973
306.364 mln
+5.872 mln
1.95%
jan 1, 1974
312.244 mln
+5.88 mln
1.92%
jan 1, 1975
318.246 mln
+6.002 mln
1.92%
jan 1, 1976
326.377 mln
+8.131 mln
2.55%
jan 1, 1977
332.757 mln
+6.38 mln
1.95%
jan 1, 1978
339.278 mln
+6.521 mln
1.96%
jan 1, 1979
345.927 mln
+6.649 mln
1.96%
jan 1, 1980
352.907 mln
+6.98 mln
2.02%
jan 1, 1981
359.886 mln
+6.979 mln
1.98%
jan 1, 1982
367.331 mln
+7.444 mln
2.07%
jan 1, 1983
375.626 mln
+8.295 mln
2.26%
jan 1, 1984
384.061 mln
+8.435 mln
2.25%
jan 1, 1985
392.607 mln
+8.546 mln
2.23%
jan 1, 1986
401.276 mln
+8.67 mln
2.21%
jan 1, 1987
410.183 mln
+8.907 mln
2.22%
jan 1, 1988
419.314 mln
+9.131 mln
2.23%
jan 1, 1989
428.662 mln
+9.347 mln
2.23%
jan 1, 1990
438.333 mln
+9.671 mln
2.26%
jan 1, 1991
448.194 mln
+9.861 mln
2.25%
jan 1, 1992
458.5 mln
+10.306 mln
2.3%
jan 1, 1993
469.196 mln
+10.695 mln
2.33%
jan 1, 1994
480.088 mln
+10.893 mln
2.32%
jan 1, 1995
491.281 mln
+11.192 mln
2.33%
jan 1, 1996
502.468 mln
+11.187 mln
2.28%
jan 1, 1997
513.561 mln
+11.093 mln
2.21%
jan 1, 1998
524.519 mln
+10.958 mln
2.13%
jan 1, 1999
535.524 mln
+11.005 mln
2.1%
jan 1, 2000
546.613 mln
+11.089 mln
2.07%
jan 1, 2001
557.797 mln
+11.184 mln
2.05%
jan 1, 2002
568.839 mln
+11.042 mln
1.98%
jan 1, 2003
579.823 mln
+10.984 mln
1.93%
jan 1, 2004
590.791 mln
+10.968 mln
1.89%
jan 1, 2005
601.744 mln
+10.953 mln
1.85%
jan 1, 2006
612.61 mln
+10.867 mln
1.81%
jan 1, 2007
623.427 mln
+10.817 mln
1.77%
jan 1, 2008
634.185 mln
+10.758 mln
1.73%
jan 1, 2009
644.789 mln
+10.604 mln
1.67%
jan 1, 2010
655.408 mln
+10.619 mln
1.65%
jan 1, 2011
666.066 mln
+10.658 mln
1.63%
jan 1, 2012
676.761 mln
+10.696 mln
1.61%
jan 1, 2013
687.512 mln
+10.75 mln
1.59%
jan 1, 2014
698.349 mln
+10.837 mln
1.58%
jan 1, 2015
709.283 mln
+10.934 mln
1.57%
jan 1, 2016
720.331 mln
+11.048 mln
1.56%
Ranking of countries by current statistics by years


Comments: