29
/
en
AIzaSyAYiBZKx7MnpbEhh9jyipgxe19OcubqV5w
April 1, 2024
126878
El Salvador
SLV
true
2
1
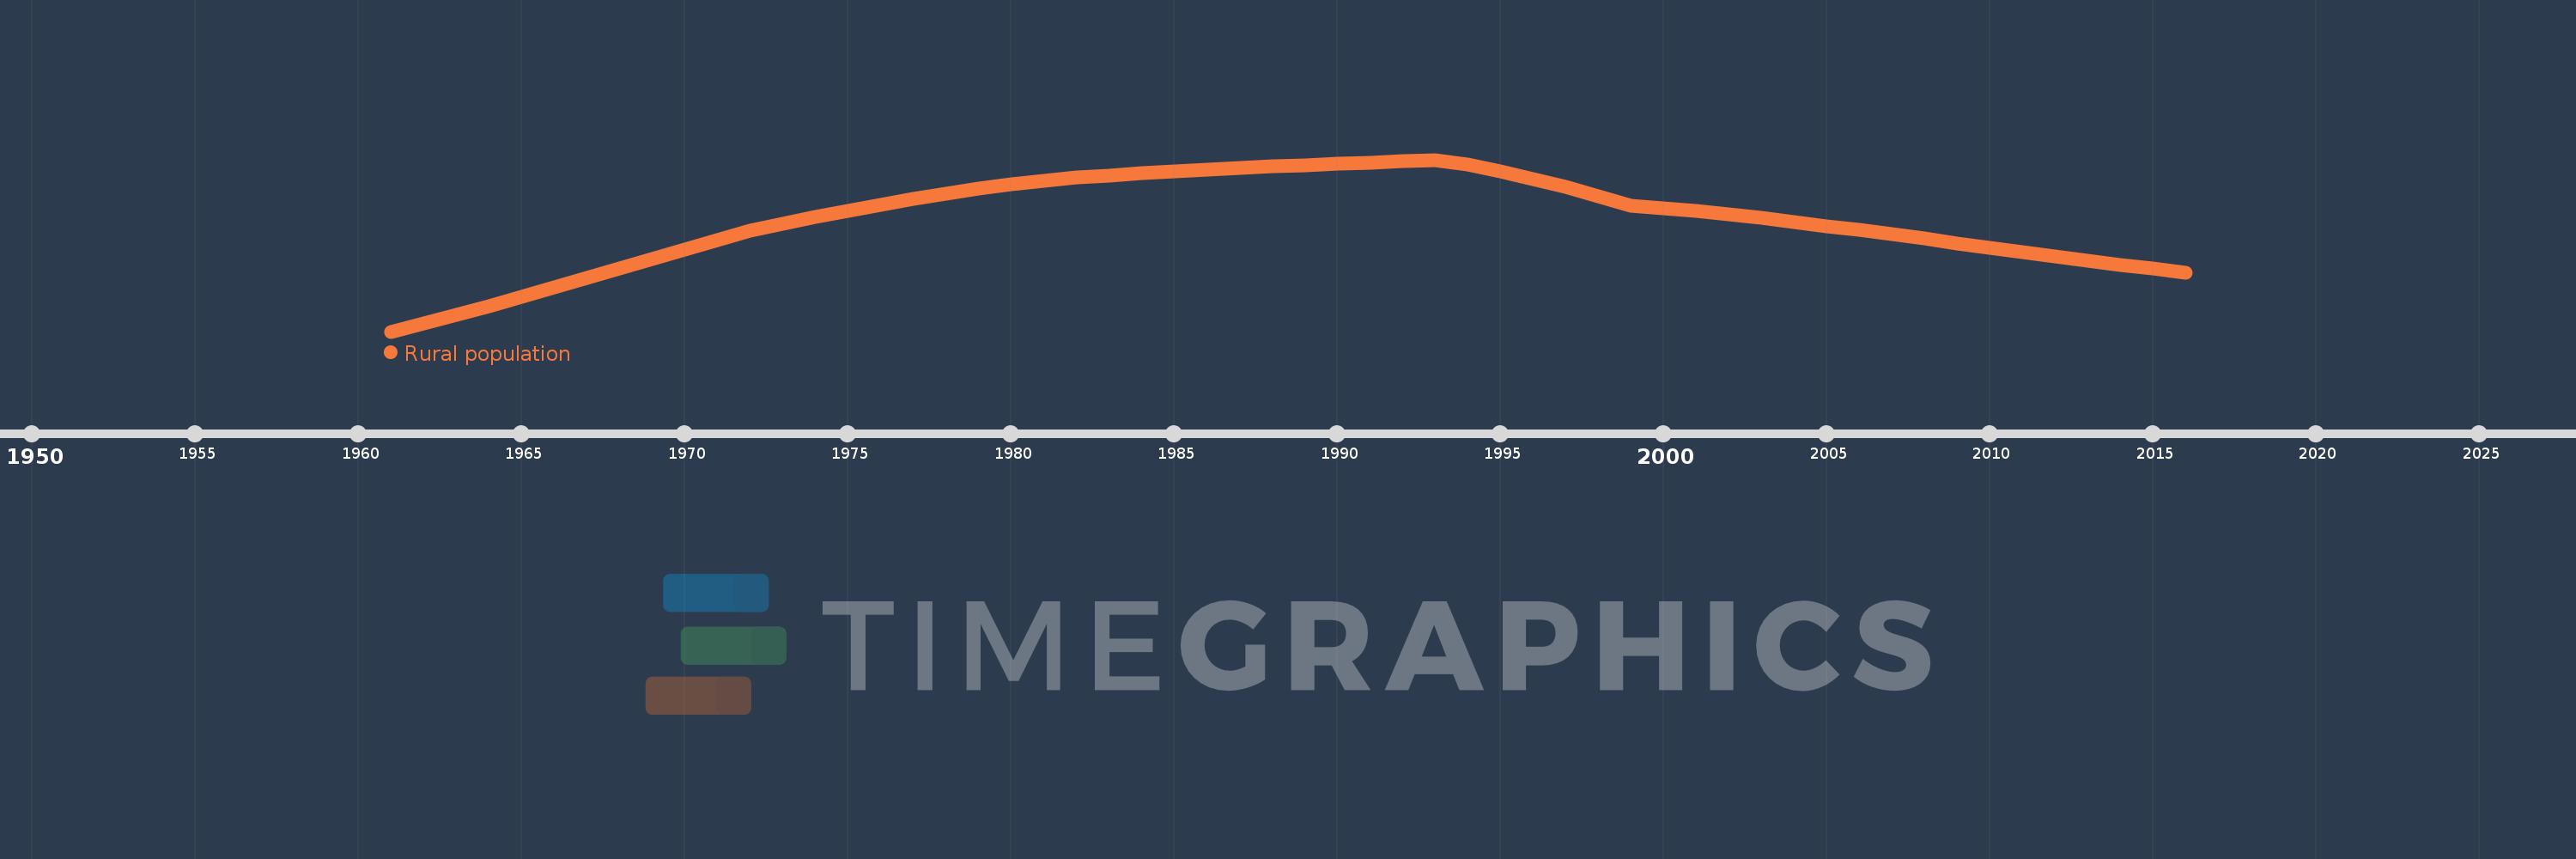
Rural population
2016,2015,2014,2013,2012,2011,2010,2009,2008,2007,2006,2005,2004,2003,2002,2001,2000,1999,1998,1997,1996,1995,1994,1993,1992,1991,1990,1989,1988,1987,1986,1985,1984,1983,1982,1981,1980,1979,1978,1977,1976,1975,1974,1973,1972,1971,1970,1969,1968,1967,1966,1965,1964,1963,1962,1961
This statistics in other country:
AfghanistanAlbaniaAlgeriaAmerican SamoaAndorraAngolaAntigua and BarbudaArab WorldArgentinaArmeniaArubaAustraliaAustriaAzerbaijanBahamas, TheBahrainBangladeshBarbadosBelarusBelgiumBelizeBeninBermudaBhutanBoliviaBosnia and HerzegovinaBotswanaBrazilBritish Virgin IslandsBrunei DarussalamBulgariaBurkina FasoBurundiCabo VerdeCambodiaCameroonCanadaCaribbean small statesCayman IslandsCentral African RepublicCentral Europe and the BalticsChadChannel IslandsChileChinaColombiaComorosCongo, Dem. Rep.Congo, Rep.Costa RicaCote d'IvoireCroatiaCubaCuracaoCyprusCzech RepublicDenmarkDjiboutiDominicaDominican RepublicEarly-demographic dividendEast Asia & PacificEast Asia & Pacific (excluding high income)East Asia & Pacific (IDA & IBRD countries)EcuadorEgypt, Arab Rep.El SalvadorEquatorial GuineaEritreaEstoniaEthiopiaEuro areaEurope & Central AsiaEurope & Central Asia (excluding high income)Europe & Central Asia (IDA & IBRD countries)European UnionFaroe IslandsFijiFinlandFragile and conflict affected situationsFranceFrench PolynesiaGabonGambia, TheGeorgiaGermanyGhanaGibraltarGreeceGreenlandGrenadaGuamGuatemalaGuineaGuinea-BissauGuyanaHaitiHeavily indebted poor countries (HIPC)High incomeHondurasHong Kong SAR, ChinaHungaryIBRD onlyIcelandIDA & IBRD totalIDA blendIDA onlyIDA totalIndiaIndonesiaIran, Islamic Rep.IraqIrelandIsle of ManIsraelItalyJamaicaJapanJordanKazakhstanKenyaKiribatiKorea, Dem. People’s Rep.Korea, Rep.KuwaitKyrgyz RepublicLao PDRLate-demographic dividendLatin America & Caribbean Latin America & Caribbean (excluding high income)Latin America & the Caribbean (IDA & IBRD countries)LatviaLeast developed countries: UN classificationLebanonLesothoLiberiaLibyaLiechtensteinLithuaniaLow & middle incomeLow incomeLower middle incomeLuxembourgMacao SAR, ChinaMacedonia, FYRMadagascarMalawiMalaysiaMaldivesMaliMaltaMarshall IslandsMauritaniaMauritiusMexicoMicronesia, Fed. Sts.Middle East & North AfricaMiddle East & North Africa (excluding high income)Middle East & North Africa (IDA & IBRD countries)Middle incomeMoldovaMonacoMongoliaMontenegroMoroccoMozambiqueMyanmarNamibiaNauruNepalNetherlandsNew CaledoniaNew ZealandNicaraguaNigerNigeriaNorth AmericaNorthern Mariana IslandsNorwayOECD membersOmanOther small statesPacific island small statesPakistanPalauPanamaPapua New GuineaParaguayPeruPhilippinesPolandPortugalPost-demographic dividendPre-demographic dividendPuerto RicoQatarRomaniaRussian FederationRwandaSamoaSan MarinoSao Tome and PrincipeSaudi ArabiaSenegalSerbiaSeychellesSierra LeoneSingaporeSint Maarten (Dutch part)Slovak RepublicSloveniaSmall statesSolomon IslandsSomaliaSouth AfricaSouth AsiaSouth Asia (IDA & IBRD)South SudanSpainSri LankaSt. Kitts and NevisSt. LuciaSt. Vincent and the GrenadinesSub-Saharan Africa Sub-Saharan Africa (excluding high income)Sub-Saharan Africa (IDA & IBRD countries)SudanSurinameSwazilandSwedenSwitzerlandSyrian Arab RepublicTajikistanTanzaniaThailandTimor-LesteTogoTongaTrinidad and TobagoTunisiaTurkeyTurkmenistanTurks and Caicos IslandsTuvaluUgandaUkraineUnited Arab EmiratesUnited KingdomUnited StatesUpper middle incomeUruguayUzbekistanVanuatuVenezuela, RBVietnamVirgin Islands (U.S.)West Bank and GazaWorldYemen, Rep.ZambiaZimbabwe Timeline:
This timeline shows a graph from 1961 to 2016 of El Salvador. No data until 1960. Number of actual observations by date: 56.
Source name:
World Development Indicators
Source organization:
The data on urban population shares used to estimate rural population come from the United Nations, World Urbanization Prospects. Total population figures are World Bank estimates.
Categories, topics:
Agriculture & Rural Development
Last updated:
apr 23, 2017
Indicators value changes by year
Minimum:
1.703 mln
jan 1, 1961
Maximum:
2.681 mln
jan 1, 1993
At the date of observation
Value
Absolute change
Change from previous value
jan 1, 1961
1.703 mln
+1.703 mln
0.0%
jan 1, 1962
1.748 mln
+44.677K
2.62%
jan 1, 1963
1.797 mln
+49.156K
2.81%
jan 1, 1964
1.848 mln
+51.079K
2.84%
jan 1, 1965
1.901 mln
+52.268K
2.83%
jan 1, 1966
1.954 mln
+52.964K
2.79%
jan 1, 1967
2.007 mln
+53.304K
2.73%
jan 1, 1968
2.06 mln
+53.542K
2.67%
jan 1, 1969
2.114 mln
+53.815K
2.61%
jan 1, 1970
2.169 mln
+54.233K
2.57%
jan 1, 1971
2.223 mln
+54.591K
2.52%
jan 1, 1972
2.278 mln
+54.734K
2.46%
jan 1, 1973
2.317 mln
+39.336K
1.73%
jan 1, 1974
2.355 mln
+38.095K
1.64%
jan 1, 1975
2.392 mln
+36.334K
1.54%
jan 1, 1976
2.426 mln
+34.295K
1.43%
jan 1, 1977
2.458 mln
+32.131K
1.32%
jan 1, 1978
2.488 mln
+29.97K
1.22%
jan 1, 1979
2.515 mln
+27.417K
1.1%
jan 1, 1980
2.54 mln
+24.368K
0.97%
jan 1, 1981
2.561 mln
+21.074K
0.83%
jan 1, 1982
2.579 mln
+17.742K
0.69%
jan 1, 1983
2.593 mln
+14.599K
0.57%
jan 1, 1984
2.605 mln
+12.189K
0.47%
jan 1, 1985
2.616 mln
+10.696K
0.41%
jan 1, 1986
2.626 mln
+9.933K
0.38%
jan 1, 1987
2.635 mln
+9.125K
0.35%
jan 1, 1988
2.643 mln
+8.318K
0.32%
jan 1, 1989
2.651 mln
+7.763K
0.29%
jan 1, 1990
2.659 mln
+7.619K
0.29%
jan 1, 1991
2.666 mln
+7.493K
0.28%
jan 1, 1992
2.674 mln
+7.555K
0.28%
jan 1, 1993
2.681 mln
+7.364K
0.28%
jan 1, 1994
2.655 mln
-25.809K
-0.96%
jan 1, 1995
2.616 mln
-39.413K
-1.48%
jan 1, 1996
2.573 mln
-43.355K
-1.66%
jan 1, 1997
2.525 mln
-47.487K
-1.85%
jan 1, 1998
2.474 mln
-50.736K
-2.01%
jan 1, 1999
2.421 mln
-53.819K
-2.17%
jan 1, 2000
2.405 mln
-15.466K
-0.64%
jan 1, 2001
2.388 mln
-17.191K
-0.71%
jan 1, 2002
2.369 mln
-18.744K
-0.78%
jan 1, 2003
2.349 mln
-20.325K
-0.86%
jan 1, 2004
2.327 mln
-21.631K
-0.92%
jan 1, 2005
2.304 mln
-22.822K
-0.98%
jan 1, 2006
2.281 mln
-23.573K
-1.02%
jan 1, 2007
2.257 mln
-24.36K
-1.07%
jan 1, 2008
2.232 mln
-24.956K
-1.11%
jan 1, 2009
2.206 mln
-25.133K
-1.13%
jan 1, 2010
2.181 mln
-25.062K
-1.14%
jan 1, 2011
2.157 mln
-24.84K
-1.14%
jan 1, 2012
2.132 mln
-24.482K
-1.14%
jan 1, 2013
2.108 mln
-24.185K
-1.13%
jan 1, 2014
2.084 mln
-23.673K
-1.12%
jan 1, 2015
2.061 mln
-23.136K
-1.11%
jan 1, 2016
2.039 mln
-22.486K
-1.09%
Ranking of countries by current statistics by years


Comments: