29
/
en
AIzaSyAYiBZKx7MnpbEhh9jyipgxe19OcubqV5w
April 1, 2024
205803
Namibia
NAM
true
2
1
Rural population
2016,2015,2014,2013,2012,2011,2010,2009,2008,2007,2006,2005,2004,2003,2002,2001,2000,1999,1998,1997,1996,1995,1994,1993,1992,1991,1990,1989,1988,1987,1986,1985,1984,1983,1982,1981,1980,1979,1978,1977,1976,1975,1974,1973,1972,1971,1970,1969,1968,1967,1966,1965,1964,1963,1962,1961
This statistics in other country:
AfghanistanAlbaniaAlgeriaAmerican SamoaAndorraAngolaAntigua and BarbudaArab WorldArgentinaArmeniaArubaAustraliaAustriaAzerbaijanBahamas, TheBahrainBangladeshBarbadosBelarusBelgiumBelizeBeninBermudaBhutanBoliviaBosnia and HerzegovinaBotswanaBrazilBritish Virgin IslandsBrunei DarussalamBulgariaBurkina FasoBurundiCabo VerdeCambodiaCameroonCanadaCaribbean small statesCayman IslandsCentral African RepublicCentral Europe and the BalticsChadChannel IslandsChileChinaColombiaComorosCongo, Dem. Rep.Congo, Rep.Costa RicaCote d'IvoireCroatiaCubaCuracaoCyprusCzech RepublicDenmarkDjiboutiDominicaDominican RepublicEarly-demographic dividendEast Asia & PacificEast Asia & Pacific (excluding high income)East Asia & Pacific (IDA & IBRD countries)EcuadorEgypt, Arab Rep.El SalvadorEquatorial GuineaEritreaEstoniaEthiopiaEuro areaEurope & Central AsiaEurope & Central Asia (excluding high income)Europe & Central Asia (IDA & IBRD countries)European UnionFaroe IslandsFijiFinlandFragile and conflict affected situationsFranceFrench PolynesiaGabonGambia, TheGeorgiaGermanyGhanaGibraltarGreeceGreenlandGrenadaGuamGuatemalaGuineaGuinea-BissauGuyanaHaitiHeavily indebted poor countries (HIPC)High incomeHondurasHong Kong SAR, ChinaHungaryIBRD onlyIcelandIDA & IBRD totalIDA blendIDA onlyIDA totalIndiaIndonesiaIran, Islamic Rep.IraqIrelandIsle of ManIsraelItalyJamaicaJapanJordanKazakhstanKenyaKiribatiKorea, Dem. People’s Rep.Korea, Rep.KuwaitKyrgyz RepublicLao PDRLate-demographic dividendLatin America & Caribbean Latin America & Caribbean (excluding high income)Latin America & the Caribbean (IDA & IBRD countries)LatviaLeast developed countries: UN classificationLebanonLesothoLiberiaLibyaLiechtensteinLithuaniaLow & middle incomeLow incomeLower middle incomeLuxembourgMacao SAR, ChinaMacedonia, FYRMadagascarMalawiMalaysiaMaldivesMaliMaltaMarshall IslandsMauritaniaMauritiusMexicoMicronesia, Fed. Sts.Middle East & North AfricaMiddle East & North Africa (excluding high income)Middle East & North Africa (IDA & IBRD countries)Middle incomeMoldovaMonacoMongoliaMontenegroMoroccoMozambiqueMyanmarNamibiaNauruNepalNetherlandsNew CaledoniaNew ZealandNicaraguaNigerNigeriaNorth AmericaNorthern Mariana IslandsNorwayOECD membersOmanOther small statesPacific island small statesPakistanPalauPanamaPapua New GuineaParaguayPeruPhilippinesPolandPortugalPost-demographic dividendPre-demographic dividendPuerto RicoQatarRomaniaRussian FederationRwandaSamoaSan MarinoSao Tome and PrincipeSaudi ArabiaSenegalSerbiaSeychellesSierra LeoneSingaporeSint Maarten (Dutch part)Slovak RepublicSloveniaSmall statesSolomon IslandsSomaliaSouth AfricaSouth AsiaSouth Asia (IDA & IBRD)South SudanSpainSri LankaSt. Kitts and NevisSt. LuciaSt. Vincent and the GrenadinesSub-Saharan Africa Sub-Saharan Africa (excluding high income)Sub-Saharan Africa (IDA & IBRD countries)SudanSurinameSwazilandSwedenSwitzerlandSyrian Arab RepublicTajikistanTanzaniaThailandTimor-LesteTogoTongaTrinidad and TobagoTunisiaTurkeyTurkmenistanTurks and Caicos IslandsTuvaluUgandaUkraineUnited Arab EmiratesUnited KingdomUnited StatesUpper middle incomeUruguayUzbekistanVanuatuVenezuela, RBVietnamVirgin Islands (U.S.)West Bank and GazaWorldYemen, Rep.ZambiaZimbabwe Timeline:
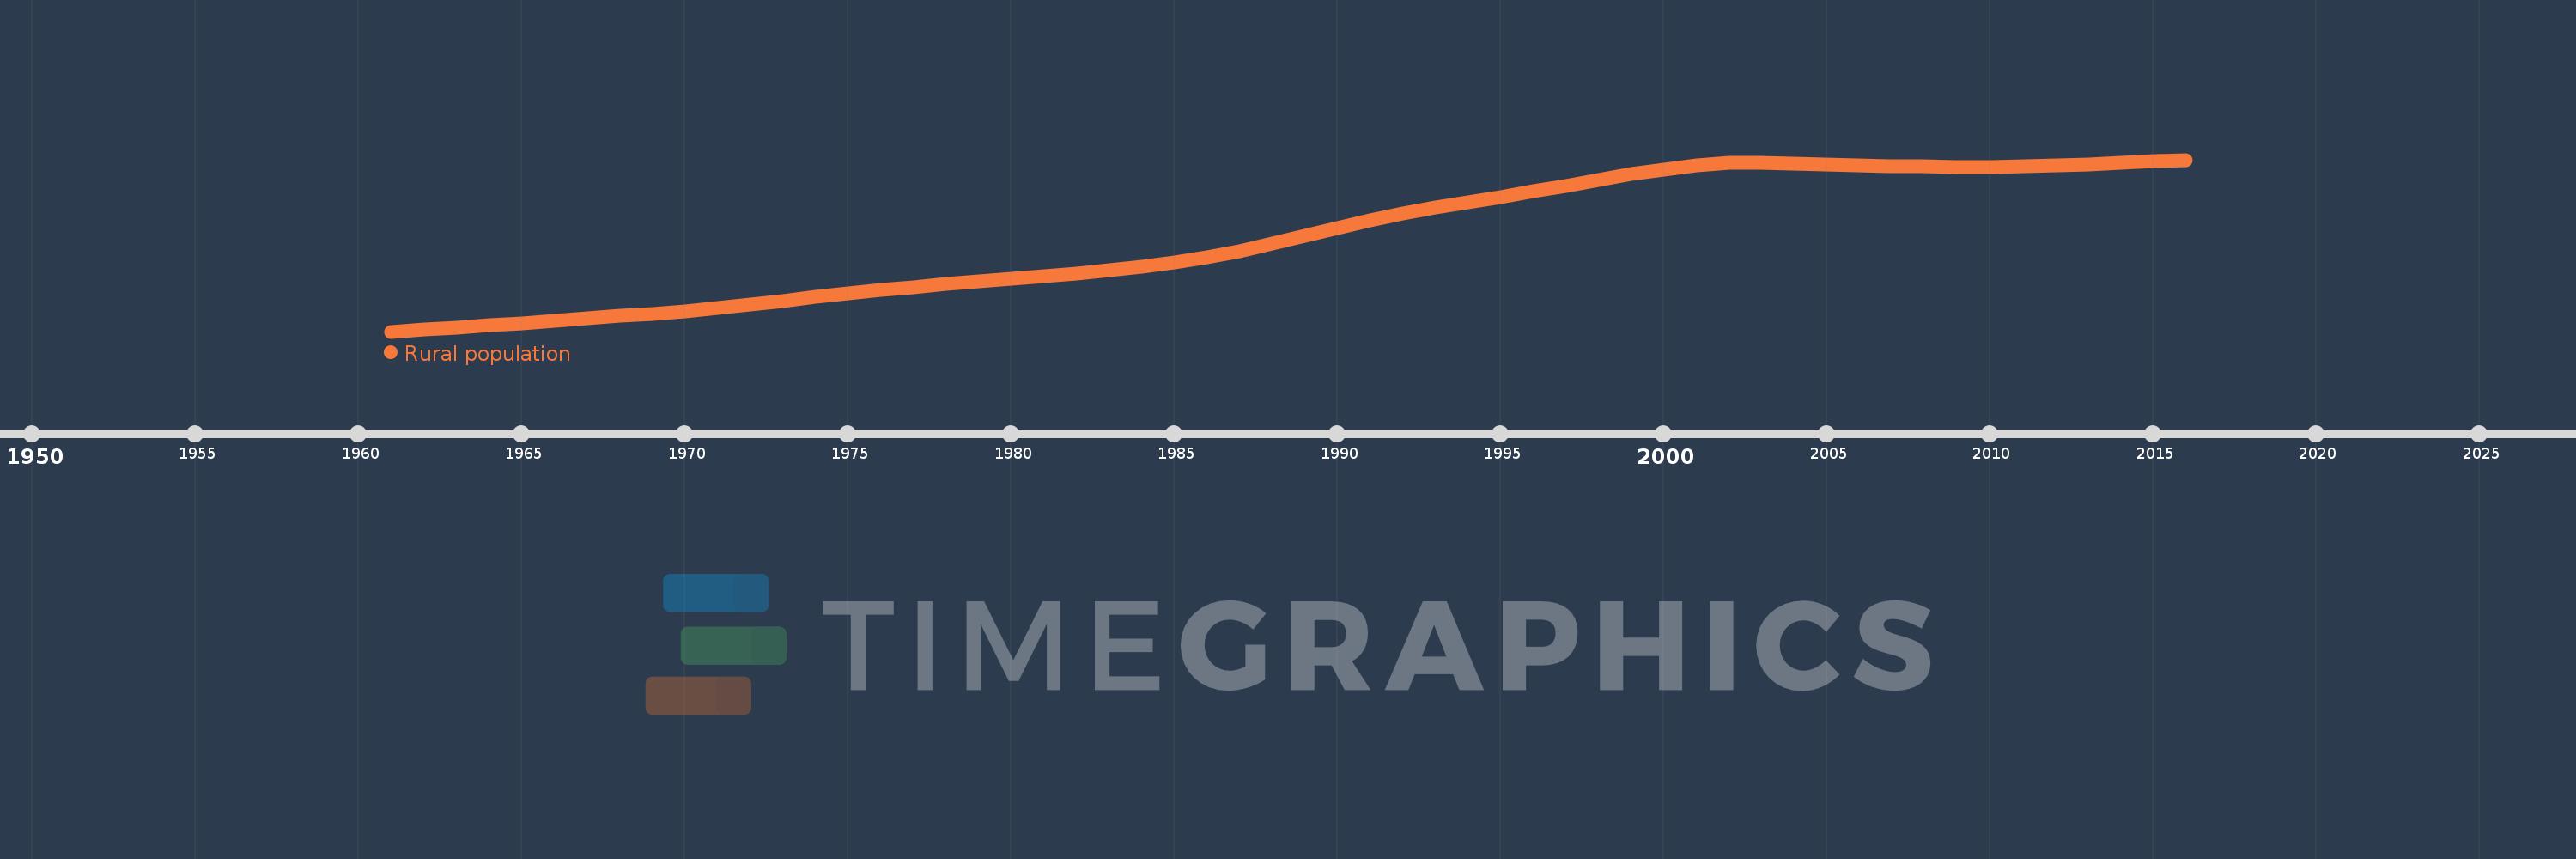
This timeline shows a graph from 1961 to 2016 of Namibia. No data until 1960. Number of actual observations by date: 56.
Source name:
World Development Indicators
Source organization:
The data on urban population shares used to estimate rural population come from the United Nations, World Urbanization Prospects. Total population figures are World Bank estimates.
Categories, topics:
Agriculture & Rural Development
Last updated:
apr 23, 2017
Indicators value changes by year
Minimum:
494.635K
jan 1, 1961
Maximum:
1.312 mln
jan 1, 2016
At the date of observation
Value
Absolute change
Change from previous value
jan 1, 1961
494.635K
+494.635K
0.0%
jan 1, 1962
504.11K
+9.475K
1.92%
jan 1, 1963
514.047K
+9.937K
1.97%
jan 1, 1964
524.318K
+10.271K
2.0%
jan 1, 1965
534.899K
+10.581K
2.02%
jan 1, 1966
545.804K
+10.905K
2.04%
jan 1, 1967
556.905K
+11.101K
2.03%
jan 1, 1968
568.222K
+11.317K
2.03%
jan 1, 1969
580.008K
+11.786K
2.07%
jan 1, 1970
592.6K
+12.592K
2.17%
jan 1, 1971
606.422K
+13.822K
2.33%
jan 1, 1972
622.865K
+16.443K
2.71%
jan 1, 1973
640.37K
+17.505K
2.81%
jan 1, 1974
658.237K
+17.867K
2.79%
jan 1, 1975
675.481K
+17.244K
2.62%
jan 1, 1976
691.452K
+15.971K
2.36%
jan 1, 1977
706.112K
+14.66K
2.12%
jan 1, 1978
719.803K
+13.691K
1.94%
jan 1, 1979
732.848K
+13.045K
1.81%
jan 1, 1980
745.725K
+12.877K
1.76%
jan 1, 1981
758.902K
+13.177K
1.77%
jan 1, 1982
772.162K
+13.26K
1.75%
jan 1, 1983
786.112K
+13.95K
1.81%
jan 1, 1984
801.991K
+15.879K
2.02%
jan 1, 1985
821.656K
+19.665K
2.45%
jan 1, 1986
846.341K
+24.685K
3.0%
jan 1, 1987
876.71K
+30.369K
3.59%
jan 1, 1988
911.98K
+35.27K
4.02%
jan 1, 1989
950.058K
+38.078K
4.18%
jan 1, 1990
988.097K
+38.039K
4.0%
jan 1, 1991
1.024 mln
+35.894K
3.63%
jan 1, 1992
1.057 mln
+32.826K
3.21%
jan 1, 1993
1.085 mln
+27.953K
2.65%
jan 1, 1994
1.11 mln
+25.221K
2.33%
jan 1, 1995
1.135 mln
+25.072K
2.26%
jan 1, 1996
1.161 mln
+25.98K
2.29%
jan 1, 1997
1.188 mln
+27.312K
2.35%
jan 1, 1998
1.216 mln
+27.844K
2.34%
jan 1, 1999
1.243 mln
+26.583K
2.19%
jan 1, 2000
1.266 mln
+22.963K
1.85%
jan 1, 2001
1.284 mln
+17.784K
1.41%
jan 1, 2002
1.296 mln
+12.214K
0.95%
jan 1, 2003
1.297 mln
+952.0
0.07%
jan 1, 2004
1.293 mln
-3.587K
-0.28%
jan 1, 2005
1.288 mln
-4.662K
-0.36%
jan 1, 2006
1.284 mln
-3.96K
-0.31%
jan 1, 2007
1.281 mln
-3.048K
-0.24%
jan 1, 2008
1.279 mln
-2.328K
-0.18%
jan 1, 2009
1.278 mln
-1.162K
-0.09%
jan 1, 2010
1.278 mln
+531.0
0.04%
jan 1, 2011
1.281 mln
+2.258K
0.18%
jan 1, 2012
1.285 mln
+4.287K
0.33%
jan 1, 2013
1.291 mln
+5.951K
0.46%
jan 1, 2014
1.298 mln
+7.183K
0.56%
jan 1, 2015
1.305 mln
+7.123K
0.55%
jan 1, 2016
1.312 mln
+6.259K
0.48%
Ranking of countries by current statistics by years


Comments: