29
/
en
AIzaSyAYiBZKx7MnpbEhh9jyipgxe19OcubqV5w
April 1, 2024
90493
Botswana
BWA
true
2
1
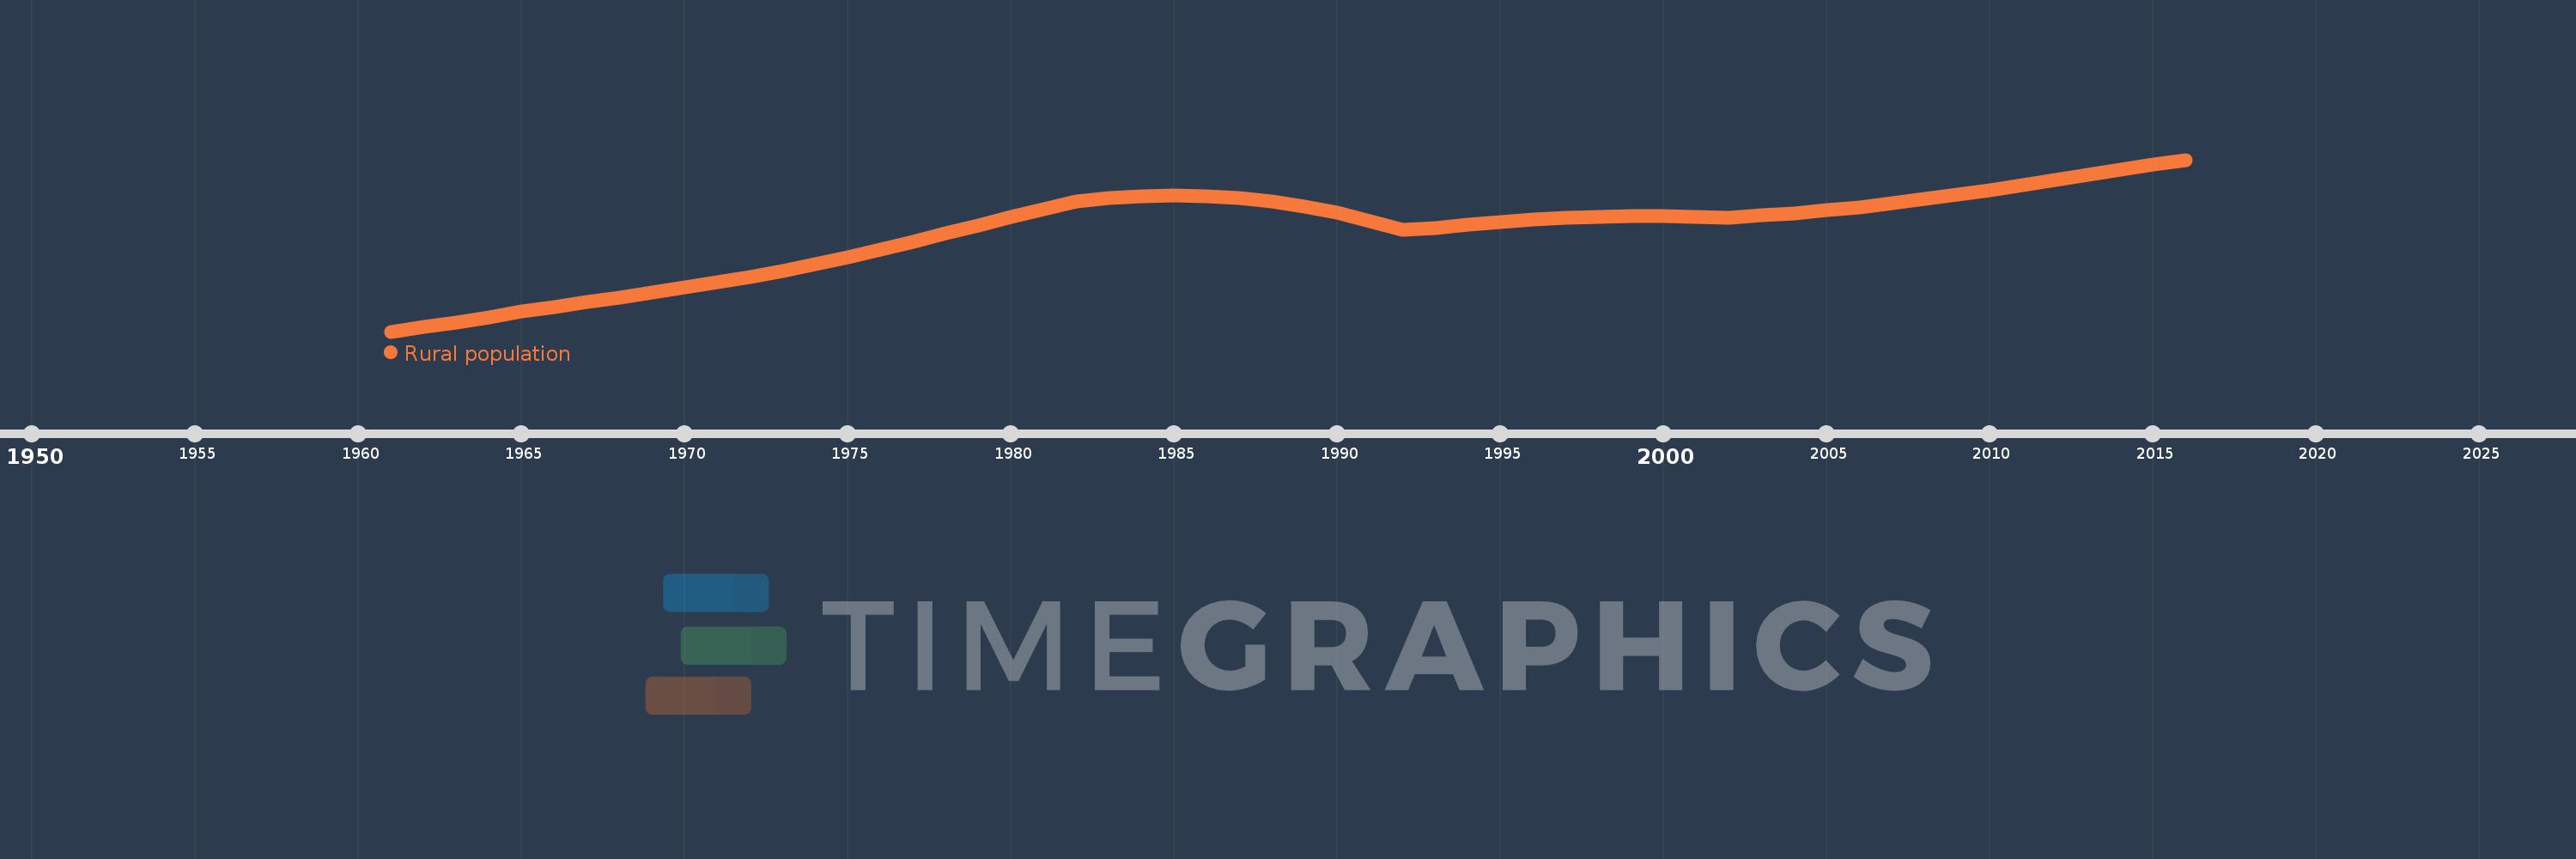
Rural population
2016,2015,2014,2013,2012,2011,2010,2009,2008,2007,2006,2005,2004,2003,2002,2001,2000,1999,1998,1997,1996,1995,1994,1993,1992,1991,1990,1989,1988,1987,1986,1985,1984,1983,1982,1981,1980,1979,1978,1977,1976,1975,1974,1973,1972,1971,1970,1969,1968,1967,1966,1965,1964,1963,1962,1961
This statistics in other country:
AfghanistanAlbaniaAlgeriaAmerican SamoaAndorraAngolaAntigua and BarbudaArab WorldArgentinaArmeniaArubaAustraliaAustriaAzerbaijanBahamas, TheBahrainBangladeshBarbadosBelarusBelgiumBelizeBeninBermudaBhutanBoliviaBosnia and HerzegovinaBotswanaBrazilBritish Virgin IslandsBrunei DarussalamBulgariaBurkina FasoBurundiCabo VerdeCambodiaCameroonCanadaCaribbean small statesCayman IslandsCentral African RepublicCentral Europe and the BalticsChadChannel IslandsChileChinaColombiaComorosCongo, Dem. Rep.Congo, Rep.Costa RicaCote d'IvoireCroatiaCubaCuracaoCyprusCzech RepublicDenmarkDjiboutiDominicaDominican RepublicEarly-demographic dividendEast Asia & PacificEast Asia & Pacific (excluding high income)East Asia & Pacific (IDA & IBRD countries)EcuadorEgypt, Arab Rep.El SalvadorEquatorial GuineaEritreaEstoniaEthiopiaEuro areaEurope & Central AsiaEurope & Central Asia (excluding high income)Europe & Central Asia (IDA & IBRD countries)European UnionFaroe IslandsFijiFinlandFragile and conflict affected situationsFranceFrench PolynesiaGabonGambia, TheGeorgiaGermanyGhanaGibraltarGreeceGreenlandGrenadaGuamGuatemalaGuineaGuinea-BissauGuyanaHaitiHeavily indebted poor countries (HIPC)High incomeHondurasHong Kong SAR, ChinaHungaryIBRD onlyIcelandIDA & IBRD totalIDA blendIDA onlyIDA totalIndiaIndonesiaIran, Islamic Rep.IraqIrelandIsle of ManIsraelItalyJamaicaJapanJordanKazakhstanKenyaKiribatiKorea, Dem. People’s Rep.Korea, Rep.KuwaitKyrgyz RepublicLao PDRLate-demographic dividendLatin America & Caribbean Latin America & Caribbean (excluding high income)Latin America & the Caribbean (IDA & IBRD countries)LatviaLeast developed countries: UN classificationLebanonLesothoLiberiaLibyaLiechtensteinLithuaniaLow & middle incomeLow incomeLower middle incomeLuxembourgMacao SAR, ChinaMacedonia, FYRMadagascarMalawiMalaysiaMaldivesMaliMaltaMarshall IslandsMauritaniaMauritiusMexicoMicronesia, Fed. Sts.Middle East & North AfricaMiddle East & North Africa (excluding high income)Middle East & North Africa (IDA & IBRD countries)Middle incomeMoldovaMonacoMongoliaMontenegroMoroccoMozambiqueMyanmarNamibiaNauruNepalNetherlandsNew CaledoniaNew ZealandNicaraguaNigerNigeriaNorth AmericaNorthern Mariana IslandsNorwayOECD membersOmanOther small statesPacific island small statesPakistanPalauPanamaPapua New GuineaParaguayPeruPhilippinesPolandPortugalPost-demographic dividendPre-demographic dividendPuerto RicoQatarRomaniaRussian FederationRwandaSamoaSan MarinoSao Tome and PrincipeSaudi ArabiaSenegalSerbiaSeychellesSierra LeoneSingaporeSint Maarten (Dutch part)Slovak RepublicSloveniaSmall statesSolomon IslandsSomaliaSouth AfricaSouth AsiaSouth Asia (IDA & IBRD)South SudanSpainSri LankaSt. Kitts and NevisSt. LuciaSt. Vincent and the GrenadinesSub-Saharan Africa Sub-Saharan Africa (excluding high income)Sub-Saharan Africa (IDA & IBRD countries)SudanSurinameSwazilandSwedenSwitzerlandSyrian Arab RepublicTajikistanTanzaniaThailandTimor-LesteTogoTongaTrinidad and TobagoTunisiaTurkeyTurkmenistanTurks and Caicos IslandsTuvaluUgandaUkraineUnited Arab EmiratesUnited KingdomUnited StatesUpper middle incomeUruguayUzbekistanVanuatuVenezuela, RBVietnamVirgin Islands (U.S.)West Bank and GazaWorldYemen, Rep.ZambiaZimbabwe Timeline:
This timeline shows a graph from 1961 to 2016 of Botswana. No data until 1960. Number of actual observations by date: 56.
Source name:
World Development Indicators
Source organization:
The data on urban population shares used to estimate rural population come from the United Nations, World Urbanization Prospects. Total population figures are World Bank estimates.
Categories, topics:
Agriculture & Rural Development
Last updated:
apr 23, 2017
Indicators value changes by year
Minimum:
507.994K
jan 1, 1961
Maximum:
962.823K
jan 1, 2016
At the date of observation
Value
Absolute change
Change from previous value
jan 1, 1961
507.994K
+507.994K
0.0%
jan 1, 1962
519.958K
+11.964K
2.36%
jan 1, 1963
532.753K
+12.795K
2.46%
jan 1, 1964
546.422K
+13.669K
2.57%
jan 1, 1965
560.33K
+13.908K
2.55%
jan 1, 1966
572.871K
+12.541K
2.24%
jan 1, 1967
585.753K
+12.882K
2.25%
jan 1, 1968
598.929K
+13.176K
2.25%
jan 1, 1969
612.259K
+13.33K
2.23%
jan 1, 1970
625.589K
+13.33K
2.18%
jan 1, 1971
638.73K
+13.141K
2.1%
jan 1, 1972
651.402K
+12.672K
1.98%
jan 1, 1973
668.035K
+16.633K
2.55%
jan 1, 1974
685.744K
+17.709K
2.65%
jan 1, 1975
704.465K
+18.721K
2.73%
jan 1, 1976
724.339K
+19.874K
2.82%
jan 1, 1977
745.377K
+21.038K
2.9%
jan 1, 1978
767.302K
+21.925K
2.94%
jan 1, 1979
789.527K
+22.225K
2.9%
jan 1, 1980
811.33K
+21.803K
2.76%
jan 1, 1981
832.146K
+20.816K
2.57%
jan 1, 1982
851.748K
+19.602K
2.36%
jan 1, 1983
861.437K
+9.689K
1.14%
jan 1, 1984
866.607K
+5.17K
0.6%
jan 1, 1985
868.393K
+1.786K
0.21%
jan 1, 1986
866.813K
-1.58K
-0.18%
jan 1, 1987
861.484K
-5.329K
-0.61%
jan 1, 1988
852.234K
-9.25K
-1.07%
jan 1, 1989
838.992K
-13.242K
-1.55%
jan 1, 1990
822.002K
-16.99K
-2.03%
jan 1, 1991
801.217K
-20.785K
-2.53%
jan 1, 1992
776.907K
-24.31K
-3.03%
jan 1, 1993
782.175K
+5.268K
0.68%
jan 1, 1994
790.898K
+8.723K
1.12%
jan 1, 1995
798.303K
+7.405K
0.94%
jan 1, 1996
804.208K
+5.905K
0.74%
jan 1, 1997
808.654K
+4.446K
0.55%
jan 1, 1998
811.781K
+3.127K
0.39%
jan 1, 1999
813.464K
+1.683K
0.21%
jan 1, 2000
813.662K
+198.0
0.02%
jan 1, 2001
812.389K
-1.273K
-0.16%
jan 1, 2002
809.671K
-2.718K
-0.33%
jan 1, 2003
815.187K
+5.516K
0.68%
jan 1, 2004
821.812K
+6.625K
0.81%
jan 1, 2005
829.006K
+7.194K
0.88%
jan 1, 2006
837.441K
+8.435K
1.02%
jan 1, 2007
847.251K
+9.81K
1.17%
jan 1, 2008
858.289K
+11.038K
1.3%
jan 1, 2009
870.348K
+12.059K
1.41%
jan 1, 2010
883.093K
+12.745K
1.46%
jan 1, 2011
896.233K
+13.14K
1.49%
jan 1, 2012
909.712K
+13.479K
1.5%
jan 1, 2013
923.533K
+13.821K
1.52%
jan 1, 2014
937.249K
+13.716K
1.49%
jan 1, 2015
950.422K
+13.173K
1.41%
jan 1, 2016
962.823K
+12.401K
1.3%
Ranking of countries by current statistics by years


Comments: