29
/
en
AIzaSyAYiBZKx7MnpbEhh9jyipgxe19OcubqV5w
April 1, 2024
283314
Virgin Islands (U.S.)
VIR
true
2
1
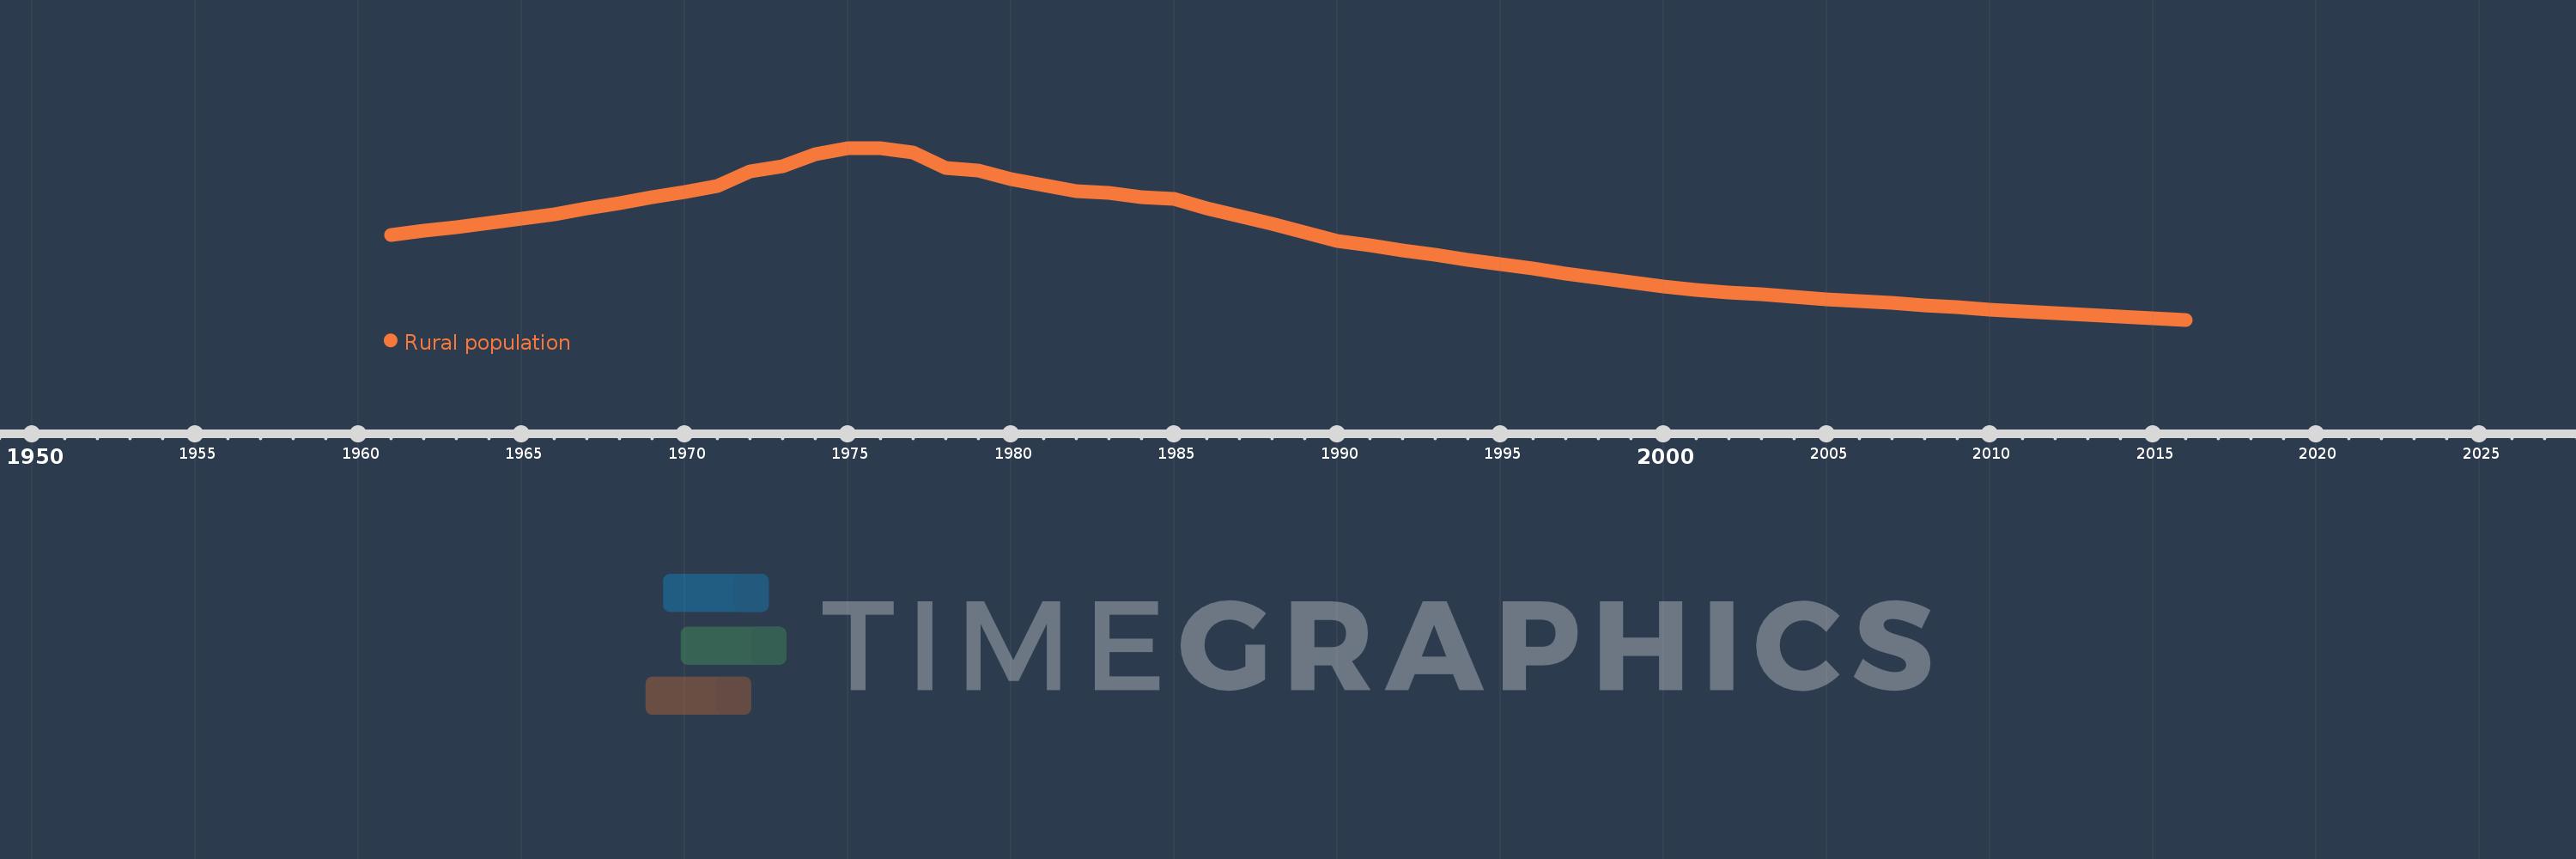
Rural population
2016,2015,2014,2013,2012,2011,2010,2009,2008,2007,2006,2005,2004,2003,2002,2001,2000,1999,1998,1997,1996,1995,1994,1993,1992,1991,1990,1989,1988,1987,1986,1985,1984,1983,1982,1981,1980,1979,1978,1977,1976,1975,1974,1973,1972,1971,1970,1969,1968,1967,1966,1965,1964,1963,1962,1961
This statistics in other country:
AfghanistanAlbaniaAlgeriaAmerican SamoaAndorraAngolaAntigua and BarbudaArab WorldArgentinaArmeniaArubaAustraliaAustriaAzerbaijanBahamas, TheBahrainBangladeshBarbadosBelarusBelgiumBelizeBeninBermudaBhutanBoliviaBosnia and HerzegovinaBotswanaBrazilBritish Virgin IslandsBrunei DarussalamBulgariaBurkina FasoBurundiCabo VerdeCambodiaCameroonCanadaCaribbean small statesCayman IslandsCentral African RepublicCentral Europe and the BalticsChadChannel IslandsChileChinaColombiaComorosCongo, Dem. Rep.Congo, Rep.Costa RicaCote d'IvoireCroatiaCubaCuracaoCyprusCzech RepublicDenmarkDjiboutiDominicaDominican RepublicEarly-demographic dividendEast Asia & PacificEast Asia & Pacific (excluding high income)East Asia & Pacific (IDA & IBRD countries)EcuadorEgypt, Arab Rep.El SalvadorEquatorial GuineaEritreaEstoniaEthiopiaEuro areaEurope & Central AsiaEurope & Central Asia (excluding high income)Europe & Central Asia (IDA & IBRD countries)European UnionFaroe IslandsFijiFinlandFragile and conflict affected situationsFranceFrench PolynesiaGabonGambia, TheGeorgiaGermanyGhanaGibraltarGreeceGreenlandGrenadaGuamGuatemalaGuineaGuinea-BissauGuyanaHaitiHeavily indebted poor countries (HIPC)High incomeHondurasHong Kong SAR, ChinaHungaryIBRD onlyIcelandIDA & IBRD totalIDA blendIDA onlyIDA totalIndiaIndonesiaIran, Islamic Rep.IraqIrelandIsle of ManIsraelItalyJamaicaJapanJordanKazakhstanKenyaKiribatiKorea, Dem. People’s Rep.Korea, Rep.KuwaitKyrgyz RepublicLao PDRLate-demographic dividendLatin America & Caribbean Latin America & Caribbean (excluding high income)Latin America & the Caribbean (IDA & IBRD countries)LatviaLeast developed countries: UN classificationLebanonLesothoLiberiaLibyaLiechtensteinLithuaniaLow & middle incomeLow incomeLower middle incomeLuxembourgMacao SAR, ChinaMacedonia, FYRMadagascarMalawiMalaysiaMaldivesMaliMaltaMarshall IslandsMauritaniaMauritiusMexicoMicronesia, Fed. Sts.Middle East & North AfricaMiddle East & North Africa (excluding high income)Middle East & North Africa (IDA & IBRD countries)Middle incomeMoldovaMonacoMongoliaMontenegroMoroccoMozambiqueMyanmarNamibiaNauruNepalNetherlandsNew CaledoniaNew ZealandNicaraguaNigerNigeriaNorth AmericaNorthern Mariana IslandsNorwayOECD membersOmanOther small statesPacific island small statesPakistanPalauPanamaPapua New GuineaParaguayPeruPhilippinesPolandPortugalPost-demographic dividendPre-demographic dividendPuerto RicoQatarRomaniaRussian FederationRwandaSamoaSan MarinoSao Tome and PrincipeSaudi ArabiaSenegalSerbiaSeychellesSierra LeoneSingaporeSint Maarten (Dutch part)Slovak RepublicSloveniaSmall statesSolomon IslandsSomaliaSouth AfricaSouth AsiaSouth Asia (IDA & IBRD)South SudanSpainSri LankaSt. Kitts and NevisSt. LuciaSt. Vincent and the GrenadinesSub-Saharan Africa Sub-Saharan Africa (excluding high income)Sub-Saharan Africa (IDA & IBRD countries)SudanSurinameSwazilandSwedenSwitzerlandSyrian Arab RepublicTajikistanTanzaniaThailandTimor-LesteTogoTongaTrinidad and TobagoTunisiaTurkeyTurkmenistanTurks and Caicos IslandsTuvaluUgandaUkraineUnited Arab EmiratesUnited KingdomUnited StatesUpper middle incomeUruguayUzbekistanVanuatuVenezuela, RBVietnamVirgin Islands (U.S.)West Bank and GazaWorldYemen, Rep.ZambiaZimbabwe Timeline:
This timeline shows a graph from 1961 to 2016 of Virgin Islands (U.S.). No data until 1960. Number of actual observations by date: 56.
Source name:
World Development Indicators
Source organization:
The data on urban population shares used to estimate rural population come from the United Nations, World Urbanization Prospects. Total population figures are World Bank estimates.
Categories, topics:
Agriculture & Rural Development
Last updated:
apr 23, 2017
Indicators value changes by year
Minimum:
4.832K
jan 1, 2016
Maximum:
23.27K
jan 1, 1976
At the date of observation
Value
Absolute change
Change from previous value
jan 1, 1961
13.927K
+13.927K
0.0%
jan 1, 1962
14.368K
+441.0
3.17%
jan 1, 1963
14.796K
+428.0
2.98%
jan 1, 1964
15.246K
+450.0
3.04%
jan 1, 1965
15.714K
+468.0
3.07%
jan 1, 1966
16.157K
+443.0
2.82%
jan 1, 1967
16.75K
+593.0
3.67%
jan 1, 1968
17.336K
+586.0
3.5%
jan 1, 1969
17.942K
+606.0
3.5%
jan 1, 1970
18.53K
+588.0
3.28%
jan 1, 1971
19.157K
+627.0
3.38%
jan 1, 1972
20.747K
+1.59K
8.3%
jan 1, 1973
21.325K
+578.0
2.79%
jan 1, 1974
22.621K
+1.296K
6.08%
jan 1, 1975
23.245K
+624.0
2.76%
jan 1, 1976
23.27K
+25.0
0.11%
jan 1, 1977
22.764K
-506.0
-2.17%
jan 1, 1978
21.113K
-1.651K
-7.25%
jan 1, 1979
20.853K
-260.0
-1.23%
jan 1, 1980
19.941K
-912.0
-4.37%
jan 1, 1981
19.257K
-684.0
-3.43%
jan 1, 1982
18.587K
-670.0
-3.48%
jan 1, 1983
18.471K
-116.0
-0.62%
jan 1, 1984
17.974K
-497.0
-2.69%
jan 1, 1985
17.805K
-169.0
-0.94%
jan 1, 1986
16.82K
-985.0
-5.53%
jan 1, 1987
15.957K
-863.0
-5.13%
jan 1, 1988
15.13K
-827.0
-5.18%
jan 1, 1989
14.205K
-925.0
-6.11%
jan 1, 1990
13.329K
-876.0
-6.17%
jan 1, 1991
12.803K
-526.0
-3.95%
jan 1, 1992
12.278K
-525.0
-4.1%
jan 1, 1993
11.776K
-502.0
-4.09%
jan 1, 1994
11.288K
-488.0
-4.14%
jan 1, 1995
10.803K
-485.0
-4.3%
jan 1, 1996
10.311K
-492.0
-4.55%
jan 1, 1997
9.818K
-493.0
-4.78%
jan 1, 1998
9.347K
-471.0
-4.8%
jan 1, 1999
8.888K
-459.0
-4.91%
jan 1, 2000
8.44K
-448.0
-5.04%
jan 1, 2001
8.054K
-386.0
-4.57%
jan 1, 2002
7.789K
-265.0
-3.29%
jan 1, 2003
7.536K
-253.0
-3.25%
jan 1, 2004
7.295K
-241.0
-3.2%
jan 1, 2005
7.059K
-236.0
-3.24%
jan 1, 2006
6.834K
-225.0
-3.19%
jan 1, 2007
6.612K
-222.0
-3.25%
jan 1, 2008
6.388K
-224.0
-3.39%
jan 1, 2009
6.17K
-218.0
-3.41%
jan 1, 2010
5.955K
-215.0
-3.48%
jan 1, 2011
5.745K
-210.0
-3.53%
jan 1, 2012
5.543K
-202.0
-3.52%
jan 1, 2013
5.352K
-191.0
-3.45%
jan 1, 2014
5.17K
-182.0
-3.4%
jan 1, 2015
4.997K
-173.0
-3.35%
jan 1, 2016
4.832K
-165.0
-3.3%
Ranking of countries by current statistics by years


Comments: