29
/
en
AIzaSyAYiBZKx7MnpbEhh9jyipgxe19OcubqV5w
April 1, 2024
54408
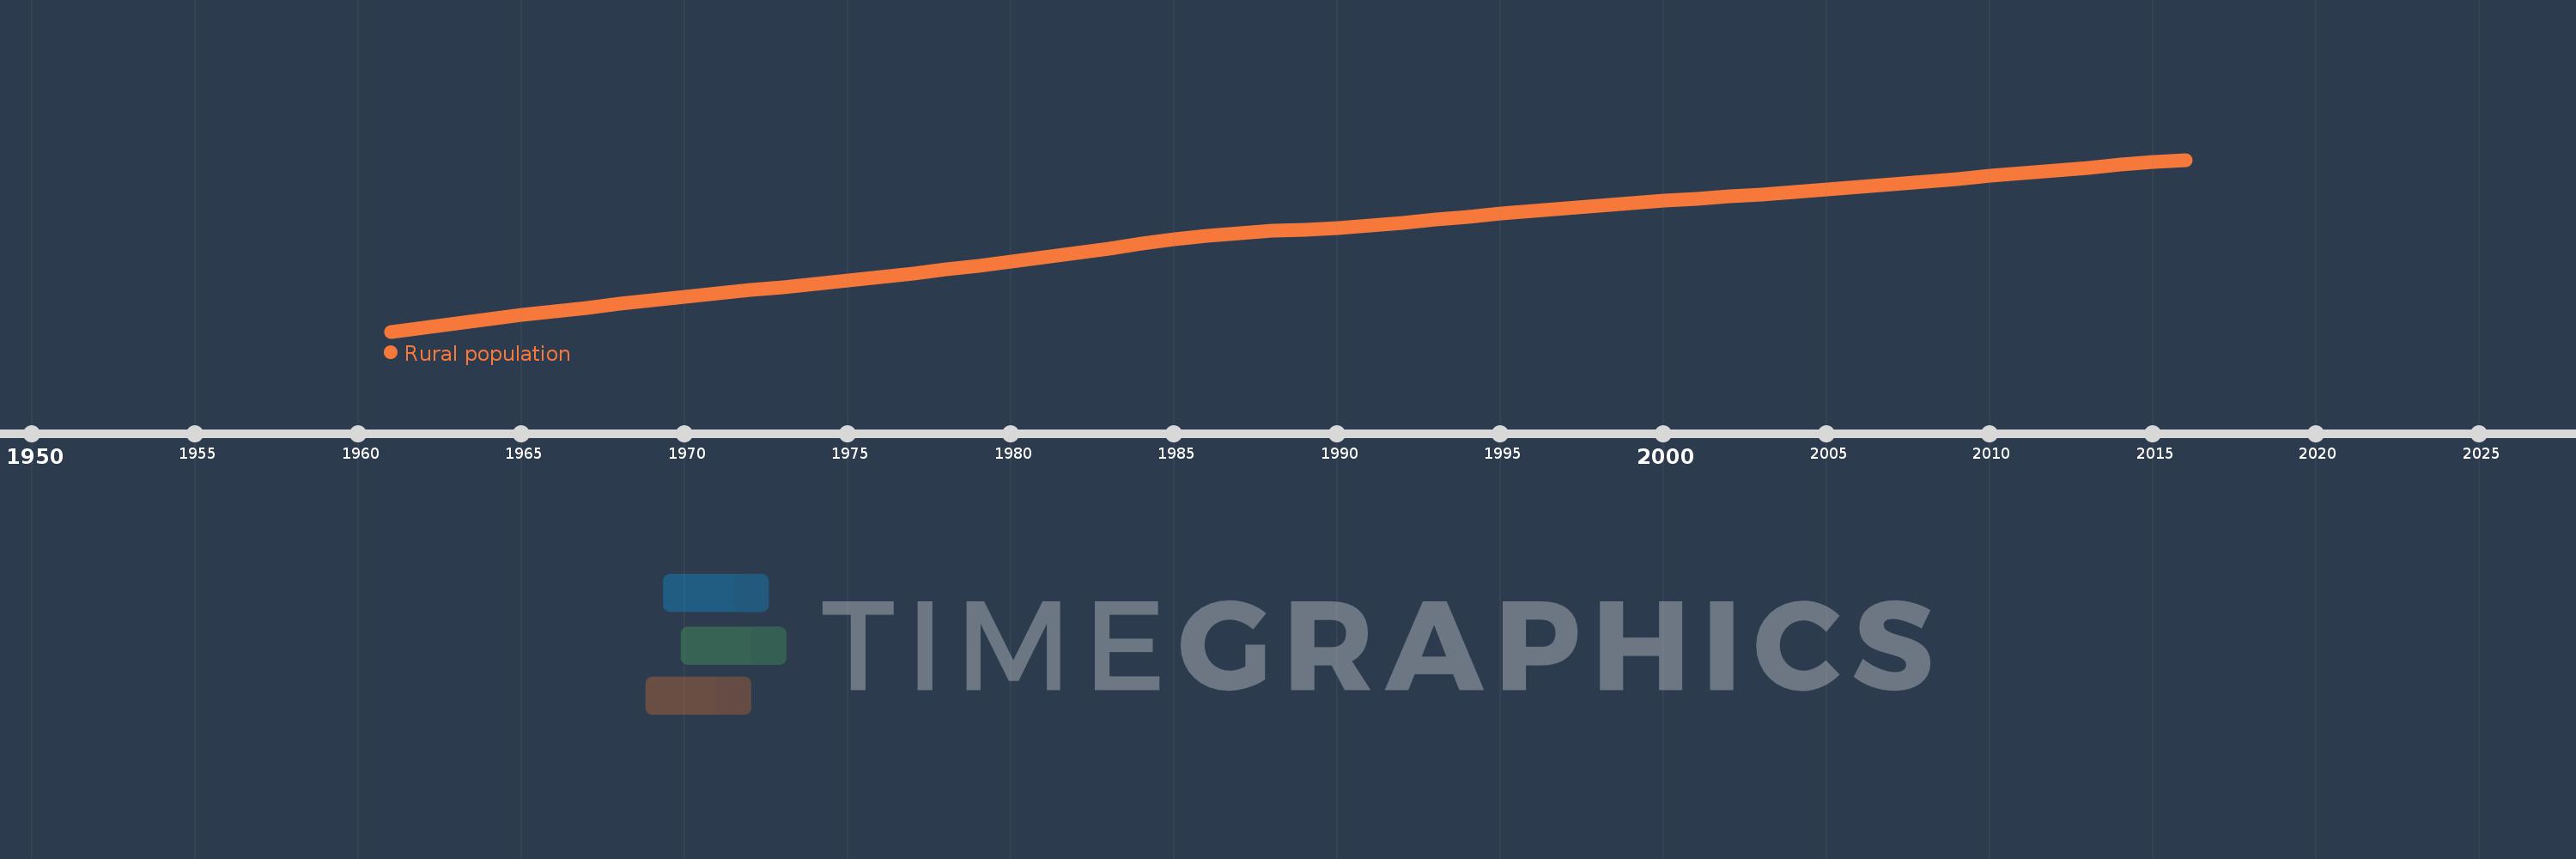
Pacific island small states
PSS
false
2
1
Rural population
2016,2015,2014,2013,2012,2011,2010,2009,2008,2007,2006,2005,2004,2003,2002,2001,2000,1999,1998,1997,1996,1995,1994,1993,1992,1991,1990,1989,1988,1987,1986,1985,1984,1983,1982,1981,1980,1979,1978,1977,1976,1975,1974,1973,1972,1971,1970,1969,1968,1967,1966,1965,1964,1963,1962,1961
This statistics in other country:
AfghanistanAlbaniaAlgeriaAmerican SamoaAndorraAngolaAntigua and BarbudaArab WorldArgentinaArmeniaArubaAustraliaAustriaAzerbaijanBahamas, TheBahrainBangladeshBarbadosBelarusBelgiumBelizeBeninBermudaBhutanBoliviaBosnia and HerzegovinaBotswanaBrazilBritish Virgin IslandsBrunei DarussalamBulgariaBurkina FasoBurundiCabo VerdeCambodiaCameroonCanadaCaribbean small statesCayman IslandsCentral African RepublicCentral Europe and the BalticsChadChannel IslandsChileChinaColombiaComorosCongo, Dem. Rep.Congo, Rep.Costa RicaCote d'IvoireCroatiaCubaCuracaoCyprusCzech RepublicDenmarkDjiboutiDominicaDominican RepublicEarly-demographic dividendEast Asia & PacificEast Asia & Pacific (excluding high income)East Asia & Pacific (IDA & IBRD countries)EcuadorEgypt, Arab Rep.El SalvadorEquatorial GuineaEritreaEstoniaEthiopiaEuro areaEurope & Central AsiaEurope & Central Asia (excluding high income)Europe & Central Asia (IDA & IBRD countries)European UnionFaroe IslandsFijiFinlandFragile and conflict affected situationsFranceFrench PolynesiaGabonGambia, TheGeorgiaGermanyGhanaGibraltarGreeceGreenlandGrenadaGuamGuatemalaGuineaGuinea-BissauGuyanaHaitiHeavily indebted poor countries (HIPC)High incomeHondurasHong Kong SAR, ChinaHungaryIBRD onlyIcelandIDA & IBRD totalIDA blendIDA onlyIDA totalIndiaIndonesiaIran, Islamic Rep.IraqIrelandIsle of ManIsraelItalyJamaicaJapanJordanKazakhstanKenyaKiribatiKorea, Dem. People’s Rep.Korea, Rep.KuwaitKyrgyz RepublicLao PDRLate-demographic dividendLatin America & Caribbean Latin America & Caribbean (excluding high income)Latin America & the Caribbean (IDA & IBRD countries)LatviaLeast developed countries: UN classificationLebanonLesothoLiberiaLibyaLiechtensteinLithuaniaLow & middle incomeLow incomeLower middle incomeLuxembourgMacao SAR, ChinaMacedonia, FYRMadagascarMalawiMalaysiaMaldivesMaliMaltaMarshall IslandsMauritaniaMauritiusMexicoMicronesia, Fed. Sts.Middle East & North AfricaMiddle East & North Africa (excluding high income)Middle East & North Africa (IDA & IBRD countries)Middle incomeMoldovaMonacoMongoliaMontenegroMoroccoMozambiqueMyanmarNamibiaNauruNepalNetherlandsNew CaledoniaNew ZealandNicaraguaNigerNigeriaNorth AmericaNorthern Mariana IslandsNorwayOECD membersOmanOther small statesPacific island small statesPakistanPalauPanamaPapua New GuineaParaguayPeruPhilippinesPolandPortugalPost-demographic dividendPre-demographic dividendPuerto RicoQatarRomaniaRussian FederationRwandaSamoaSan MarinoSao Tome and PrincipeSaudi ArabiaSenegalSerbiaSeychellesSierra LeoneSingaporeSint Maarten (Dutch part)Slovak RepublicSloveniaSmall statesSolomon IslandsSomaliaSouth AfricaSouth AsiaSouth Asia (IDA & IBRD)South SudanSpainSri LankaSt. Kitts and NevisSt. LuciaSt. Vincent and the GrenadinesSub-Saharan Africa Sub-Saharan Africa (excluding high income)Sub-Saharan Africa (IDA & IBRD countries)SudanSurinameSwazilandSwedenSwitzerlandSyrian Arab RepublicTajikistanTanzaniaThailandTimor-LesteTogoTongaTrinidad and TobagoTunisiaTurkeyTurkmenistanTurks and Caicos IslandsTuvaluUgandaUkraineUnited Arab EmiratesUnited KingdomUnited StatesUpper middle incomeUruguayUzbekistanVanuatuVenezuela, RBVietnamVirgin Islands (U.S.)West Bank and GazaWorldYemen, Rep.ZambiaZimbabwe Timeline:
This timeline shows a graph from 1961 to 2016 of Pacific island small states. No data until 1960. Number of actual observations by date: 56.
Source name:
World Development Indicators
Source organization:
The data on urban population shares used to estimate rural population come from the United Nations, World Urbanization Prospects. Total population figures are World Bank estimates.
Categories, topics:
Agriculture & Rural Development
Last updated:
apr 23, 2017
Indicators value changes by year
Minimum:
671.498K
jan 1, 1961
Maximum:
1.464 mln
jan 1, 2016
At the date of observation
Value
Absolute change
Change from previous value
jan 1, 1961
671.498K
+671.498K
0.0%
jan 1, 1962
689.624K
+18.126K
2.7%
jan 1, 1963
708.638K
+19.014K
2.76%
jan 1, 1964
728.019K
+19.381K
2.73%
jan 1, 1965
747.03K
+19.011K
2.61%
jan 1, 1966
765.178K
+18.148K
2.43%
jan 1, 1967
782.286K
+17.108K
2.24%
jan 1, 1968
799.355K
+17.069K
2.18%
jan 1, 1969
815.724K
+16.369K
2.05%
jan 1, 1970
831.378K
+15.654K
1.92%
jan 1, 1971
846.682K
+15.304K
1.84%
jan 1, 1972
861.852K
+15.17K
1.79%
jan 1, 1973
876.745K
+14.893K
1.73%
jan 1, 1974
891.483K
+14.738K
1.68%
jan 1, 1975
907.15K
+15.667K
1.76%
jan 1, 1976
923.343K
+16.193K
1.79%
jan 1, 1977
939.538K
+16.195K
1.75%
jan 1, 1978
956.733K
+17.195K
1.83%
jan 1, 1979
974.621K
+17.888K
1.87%
jan 1, 1980
993.318K
+18.697K
1.92%
jan 1, 1981
1.013 mln
+19.599K
1.97%
jan 1, 1982
1.033 mln
+20.462K
2.02%
jan 1, 1983
1.055 mln
+21.275K
2.06%
jan 1, 1984
1.076 mln
+21.135K
2.0%
jan 1, 1985
1.095 mln
+19.625K
1.82%
jan 1, 1986
1.113 mln
+17.217K
1.57%
jan 1, 1987
1.127 mln
+14.258K
1.28%
jan 1, 1988
1.136 mln
+8.774K
0.78%
jan 1, 1989
1.143 mln
+7.171K
0.63%
jan 1, 1990
1.151 mln
+7.918K
0.69%
jan 1, 1991
1.161 mln
+9.957K
0.87%
jan 1, 1992
1.173 mln
+12.133K
1.05%
jan 1, 1993
1.187 mln
+13.725K
1.17%
jan 1, 1994
1.201 mln
+14.486K
1.22%
jan 1, 1995
1.215 mln
+13.999K
1.17%
jan 1, 1996
1.228 mln
+13.088K
1.08%
jan 1, 1997
1.239 mln
+11.244K
0.92%
jan 1, 1998
1.252 mln
+12.421K
1.0%
jan 1, 1999
1.264 mln
+11.893K
0.95%
jan 1, 2000
1.275 mln
+11.252K
0.89%
jan 1, 2001
1.285 mln
+10.261K
0.8%
jan 1, 2002
1.295 mln
+9.666K
0.75%
jan 1, 2003
1.305 mln
+10.127K
0.78%
jan 1, 2004
1.315 mln
+10.294K
0.79%
jan 1, 2005
1.326 mln
+10.704K
0.81%
jan 1, 2006
1.337 mln
+11.44K
0.86%
jan 1, 2007
1.35 mln
+12.285K
0.92%
jan 1, 2008
1.363 mln
+12.973K
0.96%
jan 1, 2009
1.376 mln
+13.353K
0.98%
jan 1, 2010
1.389 mln
+13.401K
0.97%
jan 1, 2011
1.403 mln
+13.102K
0.94%
jan 1, 2012
1.415 mln
+12.771K
0.91%
jan 1, 2013
1.428 mln
+12.52K
0.88%
jan 1, 2014
1.44 mln
+12.216K
0.86%
jan 1, 2015
1.452 mln
+11.966K
0.83%
jan 1, 2016
1.464 mln
+11.763K
0.81%
Ranking of countries by current statistics by years


Comments: