29
/
en
AIzaSyAYiBZKx7MnpbEhh9jyipgxe19OcubqV5w
April 1, 2024
229153
Romania
ROU
true
2
1
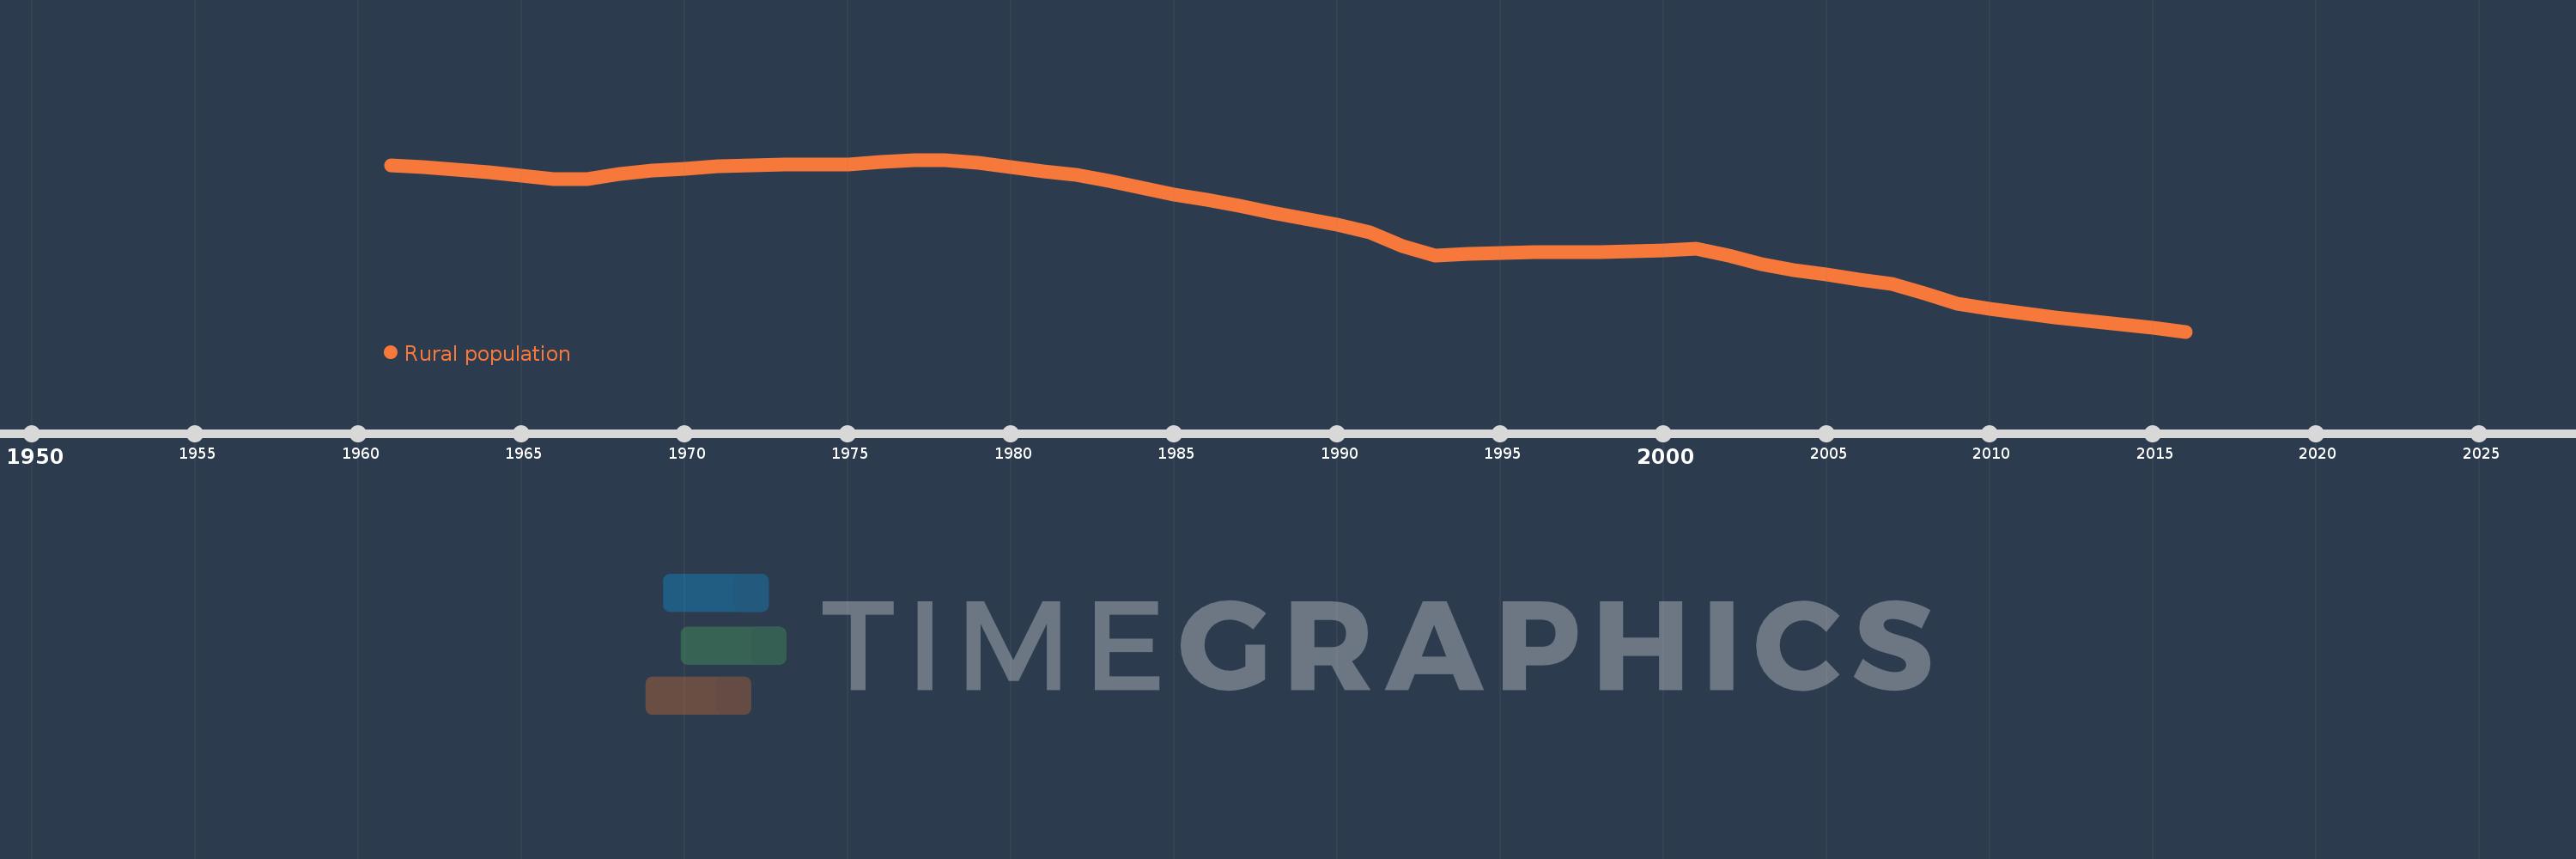
Rural population
2016,2015,2014,2013,2012,2011,2010,2009,2008,2007,2006,2005,2004,2003,2002,2001,2000,1999,1998,1997,1996,1995,1994,1993,1992,1991,1990,1989,1988,1987,1986,1985,1984,1983,1982,1981,1980,1979,1978,1977,1976,1975,1974,1973,1972,1971,1970,1969,1968,1967,1966,1965,1964,1963,1962,1961
This statistics in other country:
AfghanistanAlbaniaAlgeriaAmerican SamoaAndorraAngolaAntigua and BarbudaArab WorldArgentinaArmeniaArubaAustraliaAustriaAzerbaijanBahamas, TheBahrainBangladeshBarbadosBelarusBelgiumBelizeBeninBermudaBhutanBoliviaBosnia and HerzegovinaBotswanaBrazilBritish Virgin IslandsBrunei DarussalamBulgariaBurkina FasoBurundiCabo VerdeCambodiaCameroonCanadaCaribbean small statesCayman IslandsCentral African RepublicCentral Europe and the BalticsChadChannel IslandsChileChinaColombiaComorosCongo, Dem. Rep.Congo, Rep.Costa RicaCote d'IvoireCroatiaCubaCuracaoCyprusCzech RepublicDenmarkDjiboutiDominicaDominican RepublicEarly-demographic dividendEast Asia & PacificEast Asia & Pacific (excluding high income)East Asia & Pacific (IDA & IBRD countries)EcuadorEgypt, Arab Rep.El SalvadorEquatorial GuineaEritreaEstoniaEthiopiaEuro areaEurope & Central AsiaEurope & Central Asia (excluding high income)Europe & Central Asia (IDA & IBRD countries)European UnionFaroe IslandsFijiFinlandFragile and conflict affected situationsFranceFrench PolynesiaGabonGambia, TheGeorgiaGermanyGhanaGibraltarGreeceGreenlandGrenadaGuamGuatemalaGuineaGuinea-BissauGuyanaHaitiHeavily indebted poor countries (HIPC)High incomeHondurasHong Kong SAR, ChinaHungaryIBRD onlyIcelandIDA & IBRD totalIDA blendIDA onlyIDA totalIndiaIndonesiaIran, Islamic Rep.IraqIrelandIsle of ManIsraelItalyJamaicaJapanJordanKazakhstanKenyaKiribatiKorea, Dem. People’s Rep.Korea, Rep.KuwaitKyrgyz RepublicLao PDRLate-demographic dividendLatin America & Caribbean Latin America & Caribbean (excluding high income)Latin America & the Caribbean (IDA & IBRD countries)LatviaLeast developed countries: UN classificationLebanonLesothoLiberiaLibyaLiechtensteinLithuaniaLow & middle incomeLow incomeLower middle incomeLuxembourgMacao SAR, ChinaMacedonia, FYRMadagascarMalawiMalaysiaMaldivesMaliMaltaMarshall IslandsMauritaniaMauritiusMexicoMicronesia, Fed. Sts.Middle East & North AfricaMiddle East & North Africa (excluding high income)Middle East & North Africa (IDA & IBRD countries)Middle incomeMoldovaMonacoMongoliaMontenegroMoroccoMozambiqueMyanmarNamibiaNauruNepalNetherlandsNew CaledoniaNew ZealandNicaraguaNigerNigeriaNorth AmericaNorthern Mariana IslandsNorwayOECD membersOmanOther small statesPacific island small statesPakistanPalauPanamaPapua New GuineaParaguayPeruPhilippinesPolandPortugalPost-demographic dividendPre-demographic dividendPuerto RicoQatarRomaniaRussian FederationRwandaSamoaSan MarinoSao Tome and PrincipeSaudi ArabiaSenegalSerbiaSeychellesSierra LeoneSingaporeSint Maarten (Dutch part)Slovak RepublicSloveniaSmall statesSolomon IslandsSomaliaSouth AfricaSouth AsiaSouth Asia (IDA & IBRD)South SudanSpainSri LankaSt. Kitts and NevisSt. LuciaSt. Vincent and the GrenadinesSub-Saharan Africa Sub-Saharan Africa (excluding high income)Sub-Saharan Africa (IDA & IBRD countries)SudanSurinameSwazilandSwedenSwitzerlandSyrian Arab RepublicTajikistanTanzaniaThailandTimor-LesteTogoTongaTrinidad and TobagoTunisiaTurkeyTurkmenistanTurks and Caicos IslandsTuvaluUgandaUkraineUnited Arab EmiratesUnited KingdomUnited StatesUpper middle incomeUruguayUzbekistanVanuatuVenezuela, RBVietnamVirgin Islands (U.S.)West Bank and GazaWorldYemen, Rep.ZambiaZimbabwe Timeline:
This timeline shows a graph from 1961 to 2016 of Romania. No data until 1960. Number of actual observations by date: 56.
Source name:
World Development Indicators
Source organization:
The data on urban population shares used to estimate rural population come from the United Nations, World Urbanization Prospects. Total population figures are World Bank estimates.
Categories, topics:
Agriculture & Rural Development
Last updated:
apr 23, 2017
Indicators value changes by year
Minimum:
9.011 mln
jan 1, 2016
Maximum:
12.211 mln
jan 1, 1977
At the date of observation
Value
Absolute change
Change from previous value
jan 1, 1961
12.11 mln
+12.11 mln
0.0%
jan 1, 1962
12.081 mln
-29.506K
-0.24%
jan 1, 1963
12.03 mln
-50.268K
-0.42%
jan 1, 1964
11.977 mln
-53.075K
-0.44%
jan 1, 1965
11.921 mln
-56.108K
-0.47%
jan 1, 1966
11.857 mln
-63.887K
-0.54%
jan 1, 1967
11.847 mln
-9.957K
-0.08%
jan 1, 1968
11.948 mln
+100.833K
0.85%
jan 1, 1969
12.013 mln
+64.834K
0.54%
jan 1, 1970
12.041 mln
+28.148K
0.23%
jan 1, 1971
12.086 mln
+44.539K
0.37%
jan 1, 1972
12.11 mln
+23.925K
0.2%
jan 1, 1973
12.122 mln
+12.731K
0.11%
jan 1, 1974
12.122 mln
-305.0
0.0%
jan 1, 1975
12.129 mln
+6.732K
0.06%
jan 1, 1976
12.173 mln
+44.605K
0.37%
jan 1, 1977
12.211 mln
+38.043K
0.31%
jan 1, 1978
12.196 mln
-15.339K
-0.13%
jan 1, 1979
12.15 mln
-45.677K
-0.37%
jan 1, 1980
12.071 mln
-79.671K
-0.66%
jan 1, 1981
11.995 mln
-75.221K
-0.62%
jan 1, 1982
11.929 mln
-66.334K
-0.55%
jan 1, 1983
11.822 mln
-107.424K
-0.9%
jan 1, 1984
11.699 mln
-122.971K
-1.04%
jan 1, 1985
11.571 mln
-127.439K
-1.09%
jan 1, 1986
11.459 mln
-111.89K
-0.97%
jan 1, 1987
11.348 mln
-111.378K
-0.97%
jan 1, 1988
11.228 mln
-119.559K
-1.05%
jan 1, 1989
11.116 mln
-112.369K
-1.0%
jan 1, 1990
11.001 mln
-115.333K
-1.04%
jan 1, 1991
10.855 mln
-146.252K
-1.33%
jan 1, 1992
10.597 mln
-257.882K
-2.38%
jan 1, 1993
10.434 mln
-163.004K
-1.54%
jan 1, 1994
10.454 mln
+20.636K
0.2%
jan 1, 1995
10.474 mln
+19.363K
0.19%
jan 1, 1996
10.487 mln
+13.538K
0.13%
jan 1, 1997
10.492 mln
+4.434K
0.04%
jan 1, 1998
10.496 mln
+4.346K
0.04%
jan 1, 1999
10.508 mln
+12.509K
0.12%
jan 1, 2000
10.526 mln
+17.899K
0.17%
jan 1, 2001
10.547 mln
+20.946K
0.2%
jan 1, 2002
10.435 mln
-112.518K
-1.07%
jan 1, 2003
10.261 mln
-173.641K
-1.66%
jan 1, 2004
10.159 mln
-102.221K
-1.0%
jan 1, 2005
10.073 mln
-85.822K
-0.84%
jan 1, 2006
9.983 mln
-89.941K
-0.89%
jan 1, 2007
9.896 mln
-86.73K
-0.87%
jan 1, 2008
9.724 mln
-172.474K
-1.74%
jan 1, 2009
9.536 mln
-187.601K
-1.93%
jan 1, 2010
9.431 mln
-105.797K
-1.11%
jan 1, 2011
9.348 mln
-82.371K
-0.87%
jan 1, 2012
9.276 mln
-72.261K
-0.77%
jan 1, 2013
9.208 mln
-67.479K
-0.73%
jan 1, 2014
9.146 mln
-62.906K
-0.68%
jan 1, 2015
9.08 mln
-65.649K
-0.72%
jan 1, 2016
9.011 mln
-68.844K
-0.76%
Ranking of countries by current statistics by years


Comments: