29
/
en
AIzaSyAYiBZKx7MnpbEhh9jyipgxe19OcubqV5w
April 1, 2024
215773
Oman
OMN
true
2
1
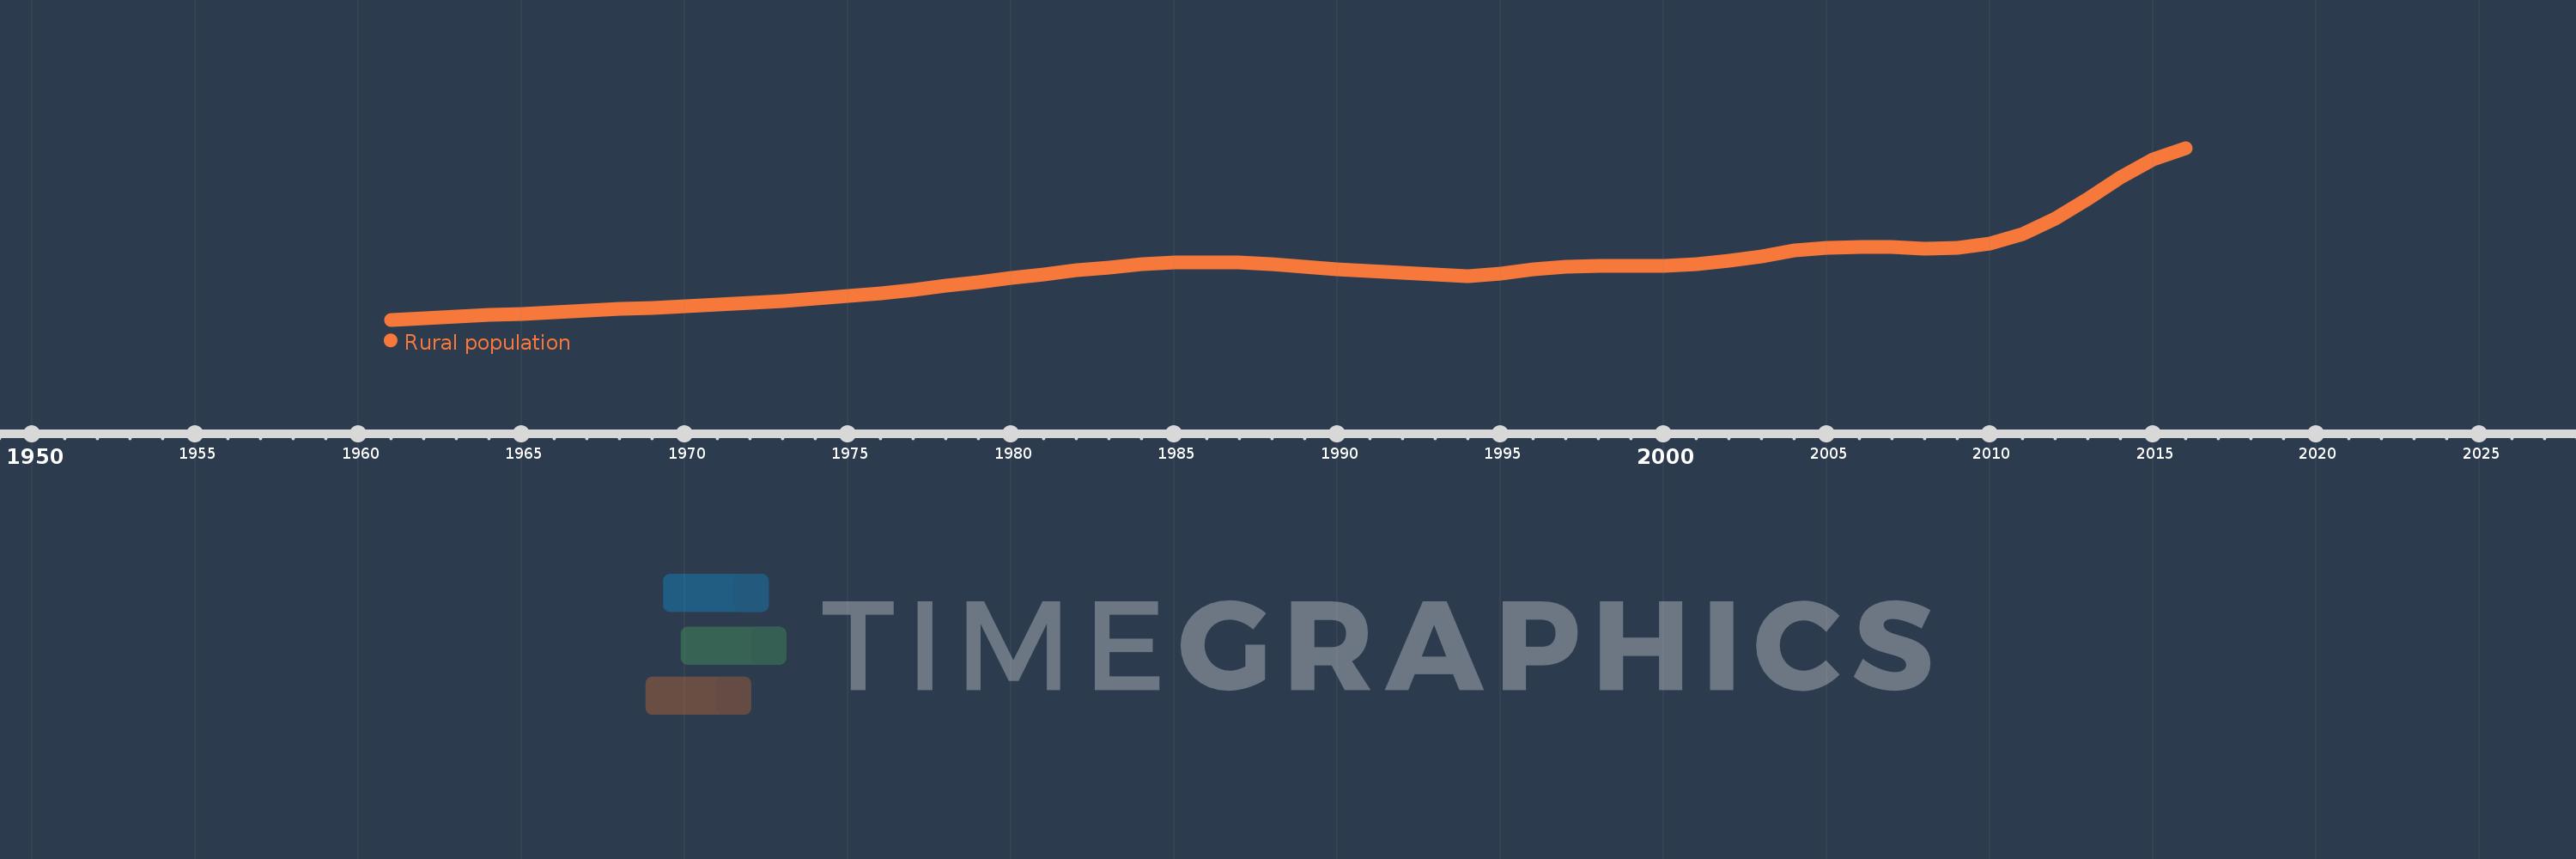
Rural population
2016,2015,2014,2013,2012,2011,2010,2009,2008,2007,2006,2005,2004,2003,2002,2001,2000,1999,1998,1997,1996,1995,1994,1993,1992,1991,1990,1989,1988,1987,1986,1985,1984,1983,1982,1981,1980,1979,1978,1977,1976,1975,1974,1973,1972,1971,1970,1969,1968,1967,1966,1965,1964,1963,1962,1961
This statistics in other country:
AfghanistanAlbaniaAlgeriaAmerican SamoaAndorraAngolaAntigua and BarbudaArab WorldArgentinaArmeniaArubaAustraliaAustriaAzerbaijanBahamas, TheBahrainBangladeshBarbadosBelarusBelgiumBelizeBeninBermudaBhutanBoliviaBosnia and HerzegovinaBotswanaBrazilBritish Virgin IslandsBrunei DarussalamBulgariaBurkina FasoBurundiCabo VerdeCambodiaCameroonCanadaCaribbean small statesCayman IslandsCentral African RepublicCentral Europe and the BalticsChadChannel IslandsChileChinaColombiaComorosCongo, Dem. Rep.Congo, Rep.Costa RicaCote d'IvoireCroatiaCubaCuracaoCyprusCzech RepublicDenmarkDjiboutiDominicaDominican RepublicEarly-demographic dividendEast Asia & PacificEast Asia & Pacific (excluding high income)East Asia & Pacific (IDA & IBRD countries)EcuadorEgypt, Arab Rep.El SalvadorEquatorial GuineaEritreaEstoniaEthiopiaEuro areaEurope & Central AsiaEurope & Central Asia (excluding high income)Europe & Central Asia (IDA & IBRD countries)European UnionFaroe IslandsFijiFinlandFragile and conflict affected situationsFranceFrench PolynesiaGabonGambia, TheGeorgiaGermanyGhanaGibraltarGreeceGreenlandGrenadaGuamGuatemalaGuineaGuinea-BissauGuyanaHaitiHeavily indebted poor countries (HIPC)High incomeHondurasHong Kong SAR, ChinaHungaryIBRD onlyIcelandIDA & IBRD totalIDA blendIDA onlyIDA totalIndiaIndonesiaIran, Islamic Rep.IraqIrelandIsle of ManIsraelItalyJamaicaJapanJordanKazakhstanKenyaKiribatiKorea, Dem. People’s Rep.Korea, Rep.KuwaitKyrgyz RepublicLao PDRLate-demographic dividendLatin America & Caribbean Latin America & Caribbean (excluding high income)Latin America & the Caribbean (IDA & IBRD countries)LatviaLeast developed countries: UN classificationLebanonLesothoLiberiaLibyaLiechtensteinLithuaniaLow & middle incomeLow incomeLower middle incomeLuxembourgMacao SAR, ChinaMacedonia, FYRMadagascarMalawiMalaysiaMaldivesMaliMaltaMarshall IslandsMauritaniaMauritiusMexicoMicronesia, Fed. Sts.Middle East & North AfricaMiddle East & North Africa (excluding high income)Middle East & North Africa (IDA & IBRD countries)Middle incomeMoldovaMonacoMongoliaMontenegroMoroccoMozambiqueMyanmarNamibiaNauruNepalNetherlandsNew CaledoniaNew ZealandNicaraguaNigerNigeriaNorth AmericaNorthern Mariana IslandsNorwayOECD membersOmanOther small statesPacific island small statesPakistanPalauPanamaPapua New GuineaParaguayPeruPhilippinesPolandPortugalPost-demographic dividendPre-demographic dividendPuerto RicoQatarRomaniaRussian FederationRwandaSamoaSan MarinoSao Tome and PrincipeSaudi ArabiaSenegalSerbiaSeychellesSierra LeoneSingaporeSint Maarten (Dutch part)Slovak RepublicSloveniaSmall statesSolomon IslandsSomaliaSouth AfricaSouth AsiaSouth Asia (IDA & IBRD)South SudanSpainSri LankaSt. Kitts and NevisSt. LuciaSt. Vincent and the GrenadinesSub-Saharan Africa Sub-Saharan Africa (excluding high income)Sub-Saharan Africa (IDA & IBRD countries)SudanSurinameSwazilandSwedenSwitzerlandSyrian Arab RepublicTajikistanTanzaniaThailandTimor-LesteTogoTongaTrinidad and TobagoTunisiaTurkeyTurkmenistanTurks and Caicos IslandsTuvaluUgandaUkraineUnited Arab EmiratesUnited KingdomUnited StatesUpper middle incomeUruguayUzbekistanVanuatuVenezuela, RBVietnamVirgin Islands (U.S.)West Bank and GazaWorldYemen, Rep.ZambiaZimbabwe Timeline:
This timeline shows a graph from 1961 to 2016 of Oman. No data until 1960. Number of actual observations by date: 56.
Source name:
World Development Indicators
Source organization:
The data on urban population shares used to estimate rural population come from the United Nations, World Urbanization Prospects. Total population figures are World Bank estimates.
Categories, topics:
Agriculture & Rural Development
Last updated:
apr 23, 2017
Indicators value changes by year
Minimum:
461.252K
jan 1, 1961
Maximum:
1.004 mln
jan 1, 2016
At the date of observation
Value
Absolute change
Change from previous value
jan 1, 1961
461.252K
+461.252K
0.0%
jan 1, 1962
466.18K
+4.928K
1.07%
jan 1, 1963
471.123K
+4.943K
1.06%
jan 1, 1964
476.026K
+4.903K
1.04%
jan 1, 1965
480.779K
+4.753K
1.0%
jan 1, 1966
485.393K
+4.614K
0.96%
jan 1, 1967
489.888K
+4.495K
0.93%
jan 1, 1968
494.388K
+4.5K
0.92%
jan 1, 1969
498.991K
+4.603K
0.93%
jan 1, 1970
503.873K
+4.882K
0.98%
jan 1, 1971
509.12K
+5.247K
1.04%
jan 1, 1972
514.64K
+5.52K
1.08%
jan 1, 1973
520.5K
+5.86K
1.14%
jan 1, 1974
527.214K
+6.714K
1.29%
jan 1, 1975
535.285K
+8.071K
1.53%
jan 1, 1976
544.989K
+9.704K
1.81%
jan 1, 1977
556.102K
+11.113K
2.04%
jan 1, 1978
568.223K
+12.121K
2.18%
jan 1, 1979
580.826K
+12.603K
2.22%
jan 1, 1980
593.38K
+12.554K
2.16%
jan 1, 1981
605.331K
+11.951K
2.01%
jan 1, 1982
616.731K
+11.4K
1.88%
jan 1, 1983
627.137K
+10.406K
1.69%
jan 1, 1984
635.632K
+8.495K
1.35%
jan 1, 1985
641.098K
+5.466K
0.86%
jan 1, 1986
643.135K
+2.037K
0.32%
jan 1, 1987
641.087K
-2.048K
-0.32%
jan 1, 1988
635.54K
-5.547K
-0.87%
jan 1, 1989
628.08K
-7.46K
-1.17%
jan 1, 1990
620.732K
-7.348K
-1.17%
jan 1, 1991
614.286K
-6.446K
-1.04%
jan 1, 1992
609.411K
-4.875K
-0.79%
jan 1, 1993
604.923K
-4.488K
-0.74%
jan 1, 1994
598.307K
-6.616K
-1.09%
jan 1, 1995
605.746K
+7.439K
1.24%
jan 1, 1996
620.977K
+15.231K
2.51%
jan 1, 1997
629.326K
+8.349K
1.34%
jan 1, 1998
631.991K
+2.665K
0.42%
jan 1, 1999
631.678K
-313.0
-0.05%
jan 1, 2000
632.281K
+603.0
0.1%
jan 1, 2001
636.685K
+4.404K
0.7%
jan 1, 2002
646.562K
+9.877K
1.55%
jan 1, 2003
661.439K
+14.877K
2.3%
jan 1, 2004
679.532K
+18.093K
2.74%
jan 1, 2005
689.73K
+10.198K
1.5%
jan 1, 2006
691.902K
+2.172K
0.31%
jan 1, 2007
690.254K
-1.648K
-0.24%
jan 1, 2008
686.643K
-3.611K
-0.52%
jan 1, 2009
687.471K
+828.0
0.12%
jan 1, 2010
700.904K
+13.433K
1.95%
jan 1, 2011
731.197K
+30.293K
4.32%
jan 1, 2012
780.32K
+49.123K
6.72%
jan 1, 2013
843.614K
+63.294K
8.11%
jan 1, 2014
910.35K
+66.736K
7.91%
jan 1, 2015
966.753K
+56.403K
6.2%
jan 1, 2016
1.004 mln
+37.287K
3.86%
Ranking of countries by current statistics by years


Comments: