29
/
en
AIzaSyAYiBZKx7MnpbEhh9jyipgxe19OcubqV5w
April 1, 2024
260232
Tajikistan
TJK
true
2
1
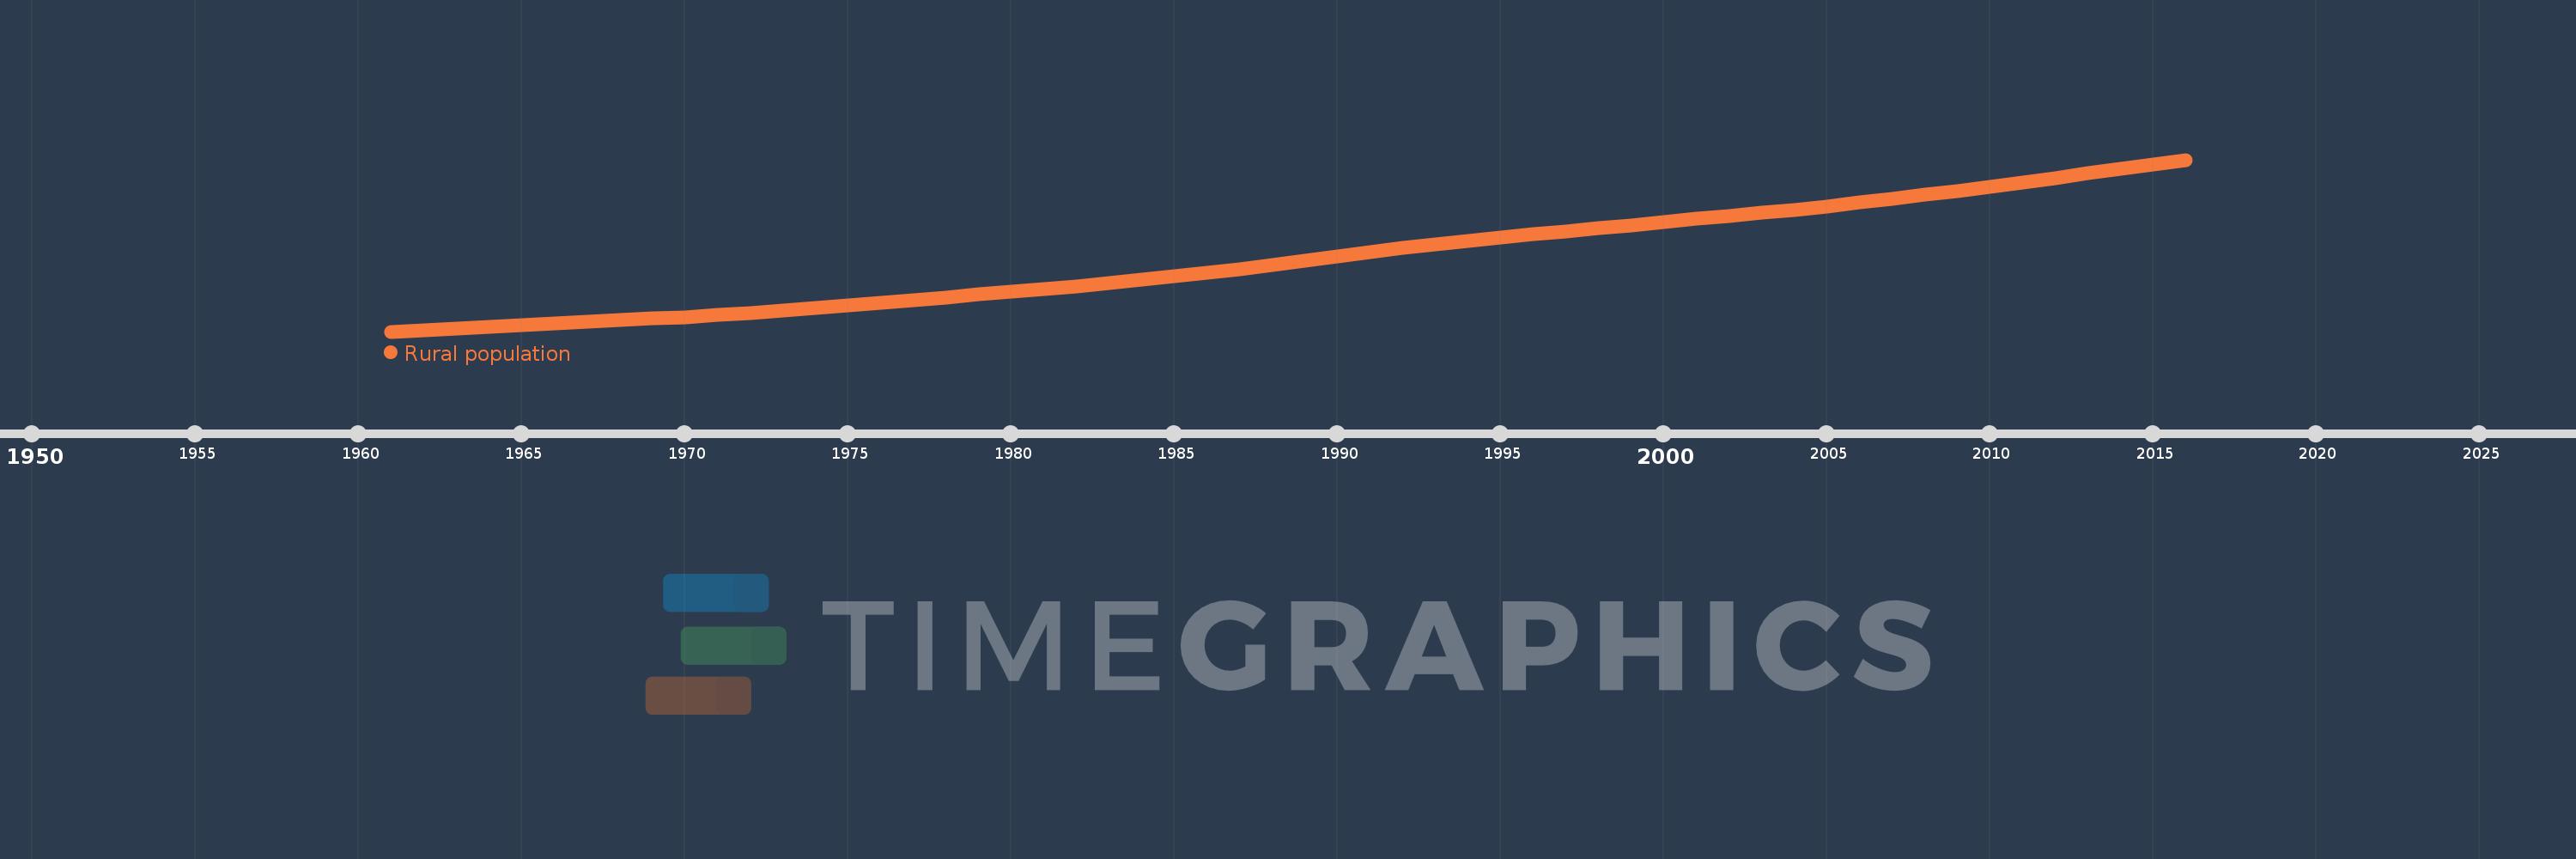
Rural population
2016,2015,2014,2013,2012,2011,2010,2009,2008,2007,2006,2005,2004,2003,2002,2001,2000,1999,1998,1997,1996,1995,1994,1993,1992,1991,1990,1989,1988,1987,1986,1985,1984,1983,1982,1981,1980,1979,1978,1977,1976,1975,1974,1973,1972,1971,1970,1969,1968,1967,1966,1965,1964,1963,1962,1961
This statistics in other country:
AfghanistanAlbaniaAlgeriaAmerican SamoaAndorraAngolaAntigua and BarbudaArab WorldArgentinaArmeniaArubaAustraliaAustriaAzerbaijanBahamas, TheBahrainBangladeshBarbadosBelarusBelgiumBelizeBeninBermudaBhutanBoliviaBosnia and HerzegovinaBotswanaBrazilBritish Virgin IslandsBrunei DarussalamBulgariaBurkina FasoBurundiCabo VerdeCambodiaCameroonCanadaCaribbean small statesCayman IslandsCentral African RepublicCentral Europe and the BalticsChadChannel IslandsChileChinaColombiaComorosCongo, Dem. Rep.Congo, Rep.Costa RicaCote d'IvoireCroatiaCubaCuracaoCyprusCzech RepublicDenmarkDjiboutiDominicaDominican RepublicEarly-demographic dividendEast Asia & PacificEast Asia & Pacific (excluding high income)East Asia & Pacific (IDA & IBRD countries)EcuadorEgypt, Arab Rep.El SalvadorEquatorial GuineaEritreaEstoniaEthiopiaEuro areaEurope & Central AsiaEurope & Central Asia (excluding high income)Europe & Central Asia (IDA & IBRD countries)European UnionFaroe IslandsFijiFinlandFragile and conflict affected situationsFranceFrench PolynesiaGabonGambia, TheGeorgiaGermanyGhanaGibraltarGreeceGreenlandGrenadaGuamGuatemalaGuineaGuinea-BissauGuyanaHaitiHeavily indebted poor countries (HIPC)High incomeHondurasHong Kong SAR, ChinaHungaryIBRD onlyIcelandIDA & IBRD totalIDA blendIDA onlyIDA totalIndiaIndonesiaIran, Islamic Rep.IraqIrelandIsle of ManIsraelItalyJamaicaJapanJordanKazakhstanKenyaKiribatiKorea, Dem. People’s Rep.Korea, Rep.KuwaitKyrgyz RepublicLao PDRLate-demographic dividendLatin America & Caribbean Latin America & Caribbean (excluding high income)Latin America & the Caribbean (IDA & IBRD countries)LatviaLeast developed countries: UN classificationLebanonLesothoLiberiaLibyaLiechtensteinLithuaniaLow & middle incomeLow incomeLower middle incomeLuxembourgMacao SAR, ChinaMacedonia, FYRMadagascarMalawiMalaysiaMaldivesMaliMaltaMarshall IslandsMauritaniaMauritiusMexicoMicronesia, Fed. Sts.Middle East & North AfricaMiddle East & North Africa (excluding high income)Middle East & North Africa (IDA & IBRD countries)Middle incomeMoldovaMonacoMongoliaMontenegroMoroccoMozambiqueMyanmarNamibiaNauruNepalNetherlandsNew CaledoniaNew ZealandNicaraguaNigerNigeriaNorth AmericaNorthern Mariana IslandsNorwayOECD membersOmanOther small statesPacific island small statesPakistanPalauPanamaPapua New GuineaParaguayPeruPhilippinesPolandPortugalPost-demographic dividendPre-demographic dividendPuerto RicoQatarRomaniaRussian FederationRwandaSamoaSan MarinoSao Tome and PrincipeSaudi ArabiaSenegalSerbiaSeychellesSierra LeoneSingaporeSint Maarten (Dutch part)Slovak RepublicSloveniaSmall statesSolomon IslandsSomaliaSouth AfricaSouth AsiaSouth Asia (IDA & IBRD)South SudanSpainSri LankaSt. Kitts and NevisSt. LuciaSt. Vincent and the GrenadinesSub-Saharan Africa Sub-Saharan Africa (excluding high income)Sub-Saharan Africa (IDA & IBRD countries)SudanSurinameSwazilandSwedenSwitzerlandSyrian Arab RepublicTajikistanTanzaniaThailandTimor-LesteTogoTongaTrinidad and TobagoTunisiaTurkeyTurkmenistanTurks and Caicos IslandsTuvaluUgandaUkraineUnited Arab EmiratesUnited KingdomUnited StatesUpper middle incomeUruguayUzbekistanVanuatuVenezuela, RBVietnamVirgin Islands (U.S.)West Bank and GazaWorldYemen, Rep.ZambiaZimbabwe Timeline:
This timeline shows a graph from 1961 to 2016 of Tajikistan. No data until 1960. Number of actual observations by date: 56.
Source name:
World Development Indicators
Source organization:
The data on urban population shares used to estimate rural population come from the United Nations, World Urbanization Prospects. Total population figures are World Bank estimates.
Categories, topics:
Agriculture & Rural Development
Last updated:
apr 23, 2017
Indicators value changes by year
Minimum:
1.379 mln
jan 1, 1961
Maximum:
6.21 mln
jan 1, 2016
At the date of observation
Value
Absolute change
Change from previous value
jan 1, 1961
1.379 mln
+1.379 mln
0.0%
jan 1, 1962
1.422 mln
+42.654K
3.09%
jan 1, 1963
1.469 mln
+46.722K
3.29%
jan 1, 1964
1.518 mln
+49.12K
3.34%
jan 1, 1965
1.567 mln
+49.087K
3.23%
jan 1, 1966
1.614 mln
+47.468K
3.03%
jan 1, 1967
1.66 mln
+45.188K
2.8%
jan 1, 1968
1.703 mln
+43.438K
2.62%
jan 1, 1969
1.746 mln
+42.606K
2.5%
jan 1, 1970
1.789 mln
+43.265K
2.48%
jan 1, 1971
1.843 mln
+53.975K
3.02%
jan 1, 1972
1.911 mln
+67.678K
3.67%
jan 1, 1973
1.981 mln
+70.582K
3.69%
jan 1, 1974
2.054 mln
+72.498K
3.66%
jan 1, 1975
2.127 mln
+73.255K
3.57%
jan 1, 1976
2.2 mln
+73.068K
3.44%
jan 1, 1977
2.273 mln
+72.663K
3.3%
jan 1, 1978
2.345 mln
+72.775K
3.2%
jan 1, 1979
2.419 mln
+74.006K
3.16%
jan 1, 1980
2.495 mln
+75.984K
3.14%
jan 1, 1981
2.574 mln
+78.854K
3.16%
jan 1, 1982
2.657 mln
+82.403K
3.2%
jan 1, 1983
2.743 mln
+85.801K
3.23%
jan 1, 1984
2.833 mln
+90.256K
3.29%
jan 1, 1985
2.929 mln
+96.133K
3.39%
jan 1, 1986
3.032 mln
+102.675K
3.51%
jan 1, 1987
3.142 mln
+110.102K
3.63%
jan 1, 1988
3.258 mln
+116.133K
3.7%
jan 1, 1989
3.375 mln
+117.624K
3.61%
jan 1, 1990
3.497 mln
+121.686K
3.61%
jan 1, 1991
3.62 mln
+123.136K
3.52%
jan 1, 1992
3.733 mln
+112.965K
3.12%
jan 1, 1993
3.837 mln
+103.902K
2.78%
jan 1, 1994
3.933 mln
+96.193K
2.51%
jan 1, 1995
4.025 mln
+91.515K
2.33%
jan 1, 1996
4.114 mln
+89.143K
2.21%
jan 1, 1997
4.201 mln
+86.998K
2.11%
jan 1, 1998
4.286 mln
+85.012K
2.02%
jan 1, 1999
4.372 mln
+86.151K
2.01%
jan 1, 2000
4.463 mln
+91.188K
2.09%
jan 1, 2001
4.548 mln
+84.35K
1.89%
jan 1, 2002
4.626 mln
+78.47K
1.73%
jan 1, 2003
4.713 mln
+87.181K
1.88%
jan 1, 2004
4.808 mln
+94.854K
2.01%
jan 1, 2005
4.906 mln
+97.312K
2.02%
jan 1, 2006
5.007 mln
+101.211K
2.06%
jan 1, 2007
5.111 mln
+104.69K
2.09%
jan 1, 2008
5.22 mln
+108.788K
2.13%
jan 1, 2009
5.333 mln
+112.782K
2.16%
jan 1, 2010
5.45 mln
+117.02K
2.19%
jan 1, 2011
5.571 mln
+121.337K
2.23%
jan 1, 2012
5.697 mln
+125.243K
2.25%
jan 1, 2013
5.824 mln
+127.264K
2.23%
jan 1, 2014
5.952 mln
+128.587K
2.21%
jan 1, 2015
6.082 mln
+129.087K
2.17%
jan 1, 2016
6.21 mln
+128.731K
2.12%
Ranking of countries by current statistics by years


Comments: