29
/
en
AIzaSyAYiBZKx7MnpbEhh9jyipgxe19OcubqV5w
April 1, 2024
32163
Europe & Central Asia (excluding high income)
ECA
false
2
1
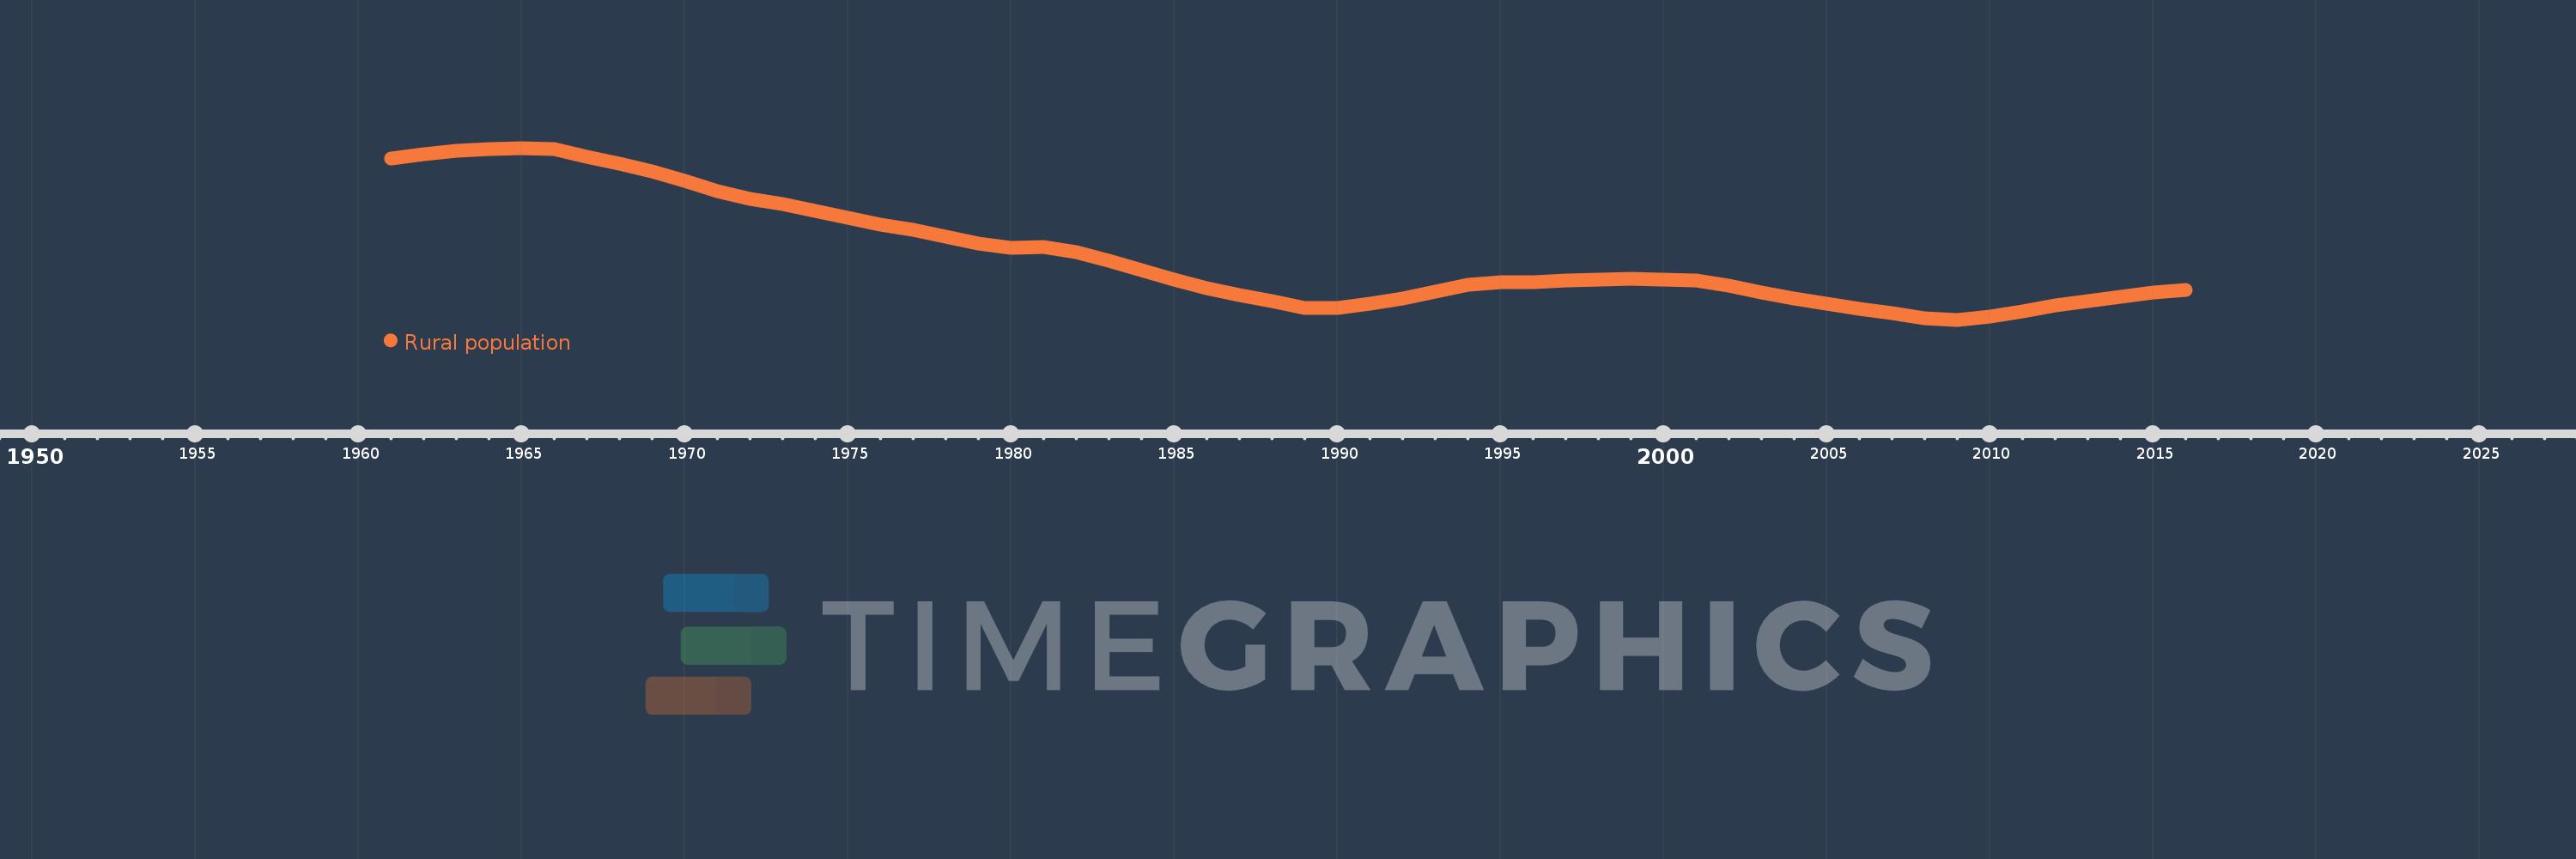
Rural population
2016,2015,2014,2013,2012,2011,2010,2009,2008,2007,2006,2005,2004,2003,2002,2001,2000,1999,1998,1997,1996,1995,1994,1993,1992,1991,1990,1989,1988,1987,1986,1985,1984,1983,1982,1981,1980,1979,1978,1977,1976,1975,1974,1973,1972,1971,1970,1969,1968,1967,1966,1965,1964,1963,1962,1961
This statistics in other country:
AfghanistanAlbaniaAlgeriaAmerican SamoaAndorraAngolaAntigua and BarbudaArab WorldArgentinaArmeniaArubaAustraliaAustriaAzerbaijanBahamas, TheBahrainBangladeshBarbadosBelarusBelgiumBelizeBeninBermudaBhutanBoliviaBosnia and HerzegovinaBotswanaBrazilBritish Virgin IslandsBrunei DarussalamBulgariaBurkina FasoBurundiCabo VerdeCambodiaCameroonCanadaCaribbean small statesCayman IslandsCentral African RepublicCentral Europe and the BalticsChadChannel IslandsChileChinaColombiaComorosCongo, Dem. Rep.Congo, Rep.Costa RicaCote d'IvoireCroatiaCubaCuracaoCyprusCzech RepublicDenmarkDjiboutiDominicaDominican RepublicEarly-demographic dividendEast Asia & PacificEast Asia & Pacific (excluding high income)East Asia & Pacific (IDA & IBRD countries)EcuadorEgypt, Arab Rep.El SalvadorEquatorial GuineaEritreaEstoniaEthiopiaEuro areaEurope & Central AsiaEurope & Central Asia (excluding high income)Europe & Central Asia (IDA & IBRD countries)European UnionFaroe IslandsFijiFinlandFragile and conflict affected situationsFranceFrench PolynesiaGabonGambia, TheGeorgiaGermanyGhanaGibraltarGreeceGreenlandGrenadaGuamGuatemalaGuineaGuinea-BissauGuyanaHaitiHeavily indebted poor countries (HIPC)High incomeHondurasHong Kong SAR, ChinaHungaryIBRD onlyIcelandIDA & IBRD totalIDA blendIDA onlyIDA totalIndiaIndonesiaIran, Islamic Rep.IraqIrelandIsle of ManIsraelItalyJamaicaJapanJordanKazakhstanKenyaKiribatiKorea, Dem. People’s Rep.Korea, Rep.KuwaitKyrgyz RepublicLao PDRLate-demographic dividendLatin America & Caribbean Latin America & Caribbean (excluding high income)Latin America & the Caribbean (IDA & IBRD countries)LatviaLeast developed countries: UN classificationLebanonLesothoLiberiaLibyaLiechtensteinLithuaniaLow & middle incomeLow incomeLower middle incomeLuxembourgMacao SAR, ChinaMacedonia, FYRMadagascarMalawiMalaysiaMaldivesMaliMaltaMarshall IslandsMauritaniaMauritiusMexicoMicronesia, Fed. Sts.Middle East & North AfricaMiddle East & North Africa (excluding high income)Middle East & North Africa (IDA & IBRD countries)Middle incomeMoldovaMonacoMongoliaMontenegroMoroccoMozambiqueMyanmarNamibiaNauruNepalNetherlandsNew CaledoniaNew ZealandNicaraguaNigerNigeriaNorth AmericaNorthern Mariana IslandsNorwayOECD membersOmanOther small statesPacific island small statesPakistanPalauPanamaPapua New GuineaParaguayPeruPhilippinesPolandPortugalPost-demographic dividendPre-demographic dividendPuerto RicoQatarRomaniaRussian FederationRwandaSamoaSan MarinoSao Tome and PrincipeSaudi ArabiaSenegalSerbiaSeychellesSierra LeoneSingaporeSint Maarten (Dutch part)Slovak RepublicSloveniaSmall statesSolomon IslandsSomaliaSouth AfricaSouth AsiaSouth Asia (IDA & IBRD)South SudanSpainSri LankaSt. Kitts and NevisSt. LuciaSt. Vincent and the GrenadinesSub-Saharan Africa Sub-Saharan Africa (excluding high income)Sub-Saharan Africa (IDA & IBRD countries)SudanSurinameSwazilandSwedenSwitzerlandSyrian Arab RepublicTajikistanTanzaniaThailandTimor-LesteTogoTongaTrinidad and TobagoTunisiaTurkeyTurkmenistanTurks and Caicos IslandsTuvaluUgandaUkraineUnited Arab EmiratesUnited KingdomUnited StatesUpper middle incomeUruguayUzbekistanVanuatuVenezuela, RBVietnamVirgin Islands (U.S.)West Bank and GazaWorldYemen, Rep.ZambiaZimbabwe Timeline:
This timeline shows a graph from 1961 to 2016 of Europe & Central Asia (excluding high income). No data until 1960. Number of actual observations by date: 56.
Source name:
World Development Indicators
Source organization:
The data on urban population shares used to estimate rural population come from the United Nations, World Urbanization Prospects. Total population figures are World Bank estimates.
Categories, topics:
Agriculture & Rural Development
Last updated:
apr 23, 2017
Indicators value changes by year
Minimum:
141.124 mln
jan 1, 2009
Maximum:
151.716 mln
jan 1, 1965
At the date of observation
Value
Absolute change
Change from previous value
jan 1, 1961
151.088 mln
+151.088 mln
0.0%
jan 1, 1962
151.335 mln
+246.664K
0.16%
jan 1, 1963
151.525 mln
+190.405K
0.13%
jan 1, 1964
151.659 mln
+133.997K
0.09%
jan 1, 1965
151.716 mln
+57.231K
0.04%
jan 1, 1966
151.626 mln
-89.918K
-0.06%
jan 1, 1967
151.19 mln
-436.661K
-0.29%
jan 1, 1968
150.768 mln
-421.453K
-0.28%
jan 1, 1969
150.253 mln
-514.948K
-0.34%
jan 1, 1970
149.678 mln
-574.875K
-0.38%
jan 1, 1971
149.046 mln
-632.629K
-0.42%
jan 1, 1972
148.6 mln
-446.037K
-0.3%
jan 1, 1973
148.282 mln
-317.729K
-0.21%
jan 1, 1974
147.856 mln
-425.488K
-0.29%
jan 1, 1975
147.409 mln
-447.248K
-0.3%
jan 1, 1976
147.0 mln
-409.203K
-0.28%
jan 1, 1977
146.661 mln
-338.677K
-0.23%
jan 1, 1978
146.269 mln
-392.666K
-0.27%
jan 1, 1979
145.802 mln
-466.54K
-0.32%
jan 1, 1980
145.545 mln
-257.107K
-0.18%
jan 1, 1981
145.609 mln
+63.529K
0.04%
jan 1, 1982
145.314 mln
-294.81K
-0.2%
jan 1, 1983
144.771 mln
-542.966K
-0.37%
jan 1, 1984
144.182 mln
-588.879K
-0.41%
jan 1, 1985
143.616 mln
-566.292K
-0.39%
jan 1, 1986
143.07 mln
-545.677K
-0.38%
jan 1, 1987
142.653 mln
-417.256K
-0.29%
jan 1, 1988
142.278 mln
-374.609K
-0.26%
jan 1, 1989
141.825 mln
-452.865K
-0.32%
jan 1, 1990
141.853 mln
+27.378K
0.02%
jan 1, 1991
142.126 mln
+273.446K
0.19%
jan 1, 1992
142.438 mln
+312.27K
0.22%
jan 1, 1993
142.858 mln
+419.525K
0.29%
jan 1, 1994
143.261 mln
+403.592K
0.28%
jan 1, 1995
143.42 mln
+158.661K
0.11%
jan 1, 1996
143.462 mln
+42.442K
0.03%
jan 1, 1997
143.539 mln
+76.341K
0.05%
jan 1, 1998
143.598 mln
+58.918K
0.04%
jan 1, 1999
143.636 mln
+38.513K
0.03%
jan 1, 2000
143.594 mln
-42.577K
-0.03%
jan 1, 2001
143.55 mln
-43.886K
-0.03%
jan 1, 2002
143.246 mln
-304.182K
-0.21%
jan 1, 2003
142.818 mln
-427.919K
-0.3%
jan 1, 2004
142.443 mln
-375.169K
-0.26%
jan 1, 2005
142.112 mln
-330.422K
-0.23%
jan 1, 2006
141.794 mln
-318.428K
-0.22%
jan 1, 2007
141.524 mln
-269.672K
-0.19%
jan 1, 2008
141.237 mln
-287.267K
-0.2%
jan 1, 2009
141.124 mln
-112.744K
-0.08%
jan 1, 2010
141.302 mln
+178.12K
0.13%
jan 1, 2011
141.626 mln
+324.177K
0.23%
jan 1, 2012
141.998 mln
+371.908K
0.26%
jan 1, 2013
142.248 mln
+249.589K
0.18%
jan 1, 2014
142.539 mln
+291.615K
0.21%
jan 1, 2015
142.806 mln
+266.222K
0.19%
jan 1, 2016
142.987 mln
+181.175K
0.13%
Ranking of countries by current statistics by years


Comments: