29
/
en
AIzaSyAYiBZKx7MnpbEhh9jyipgxe19OcubqV5w
April 1, 2024
226999
Puerto Rico
PRI
true
2
1
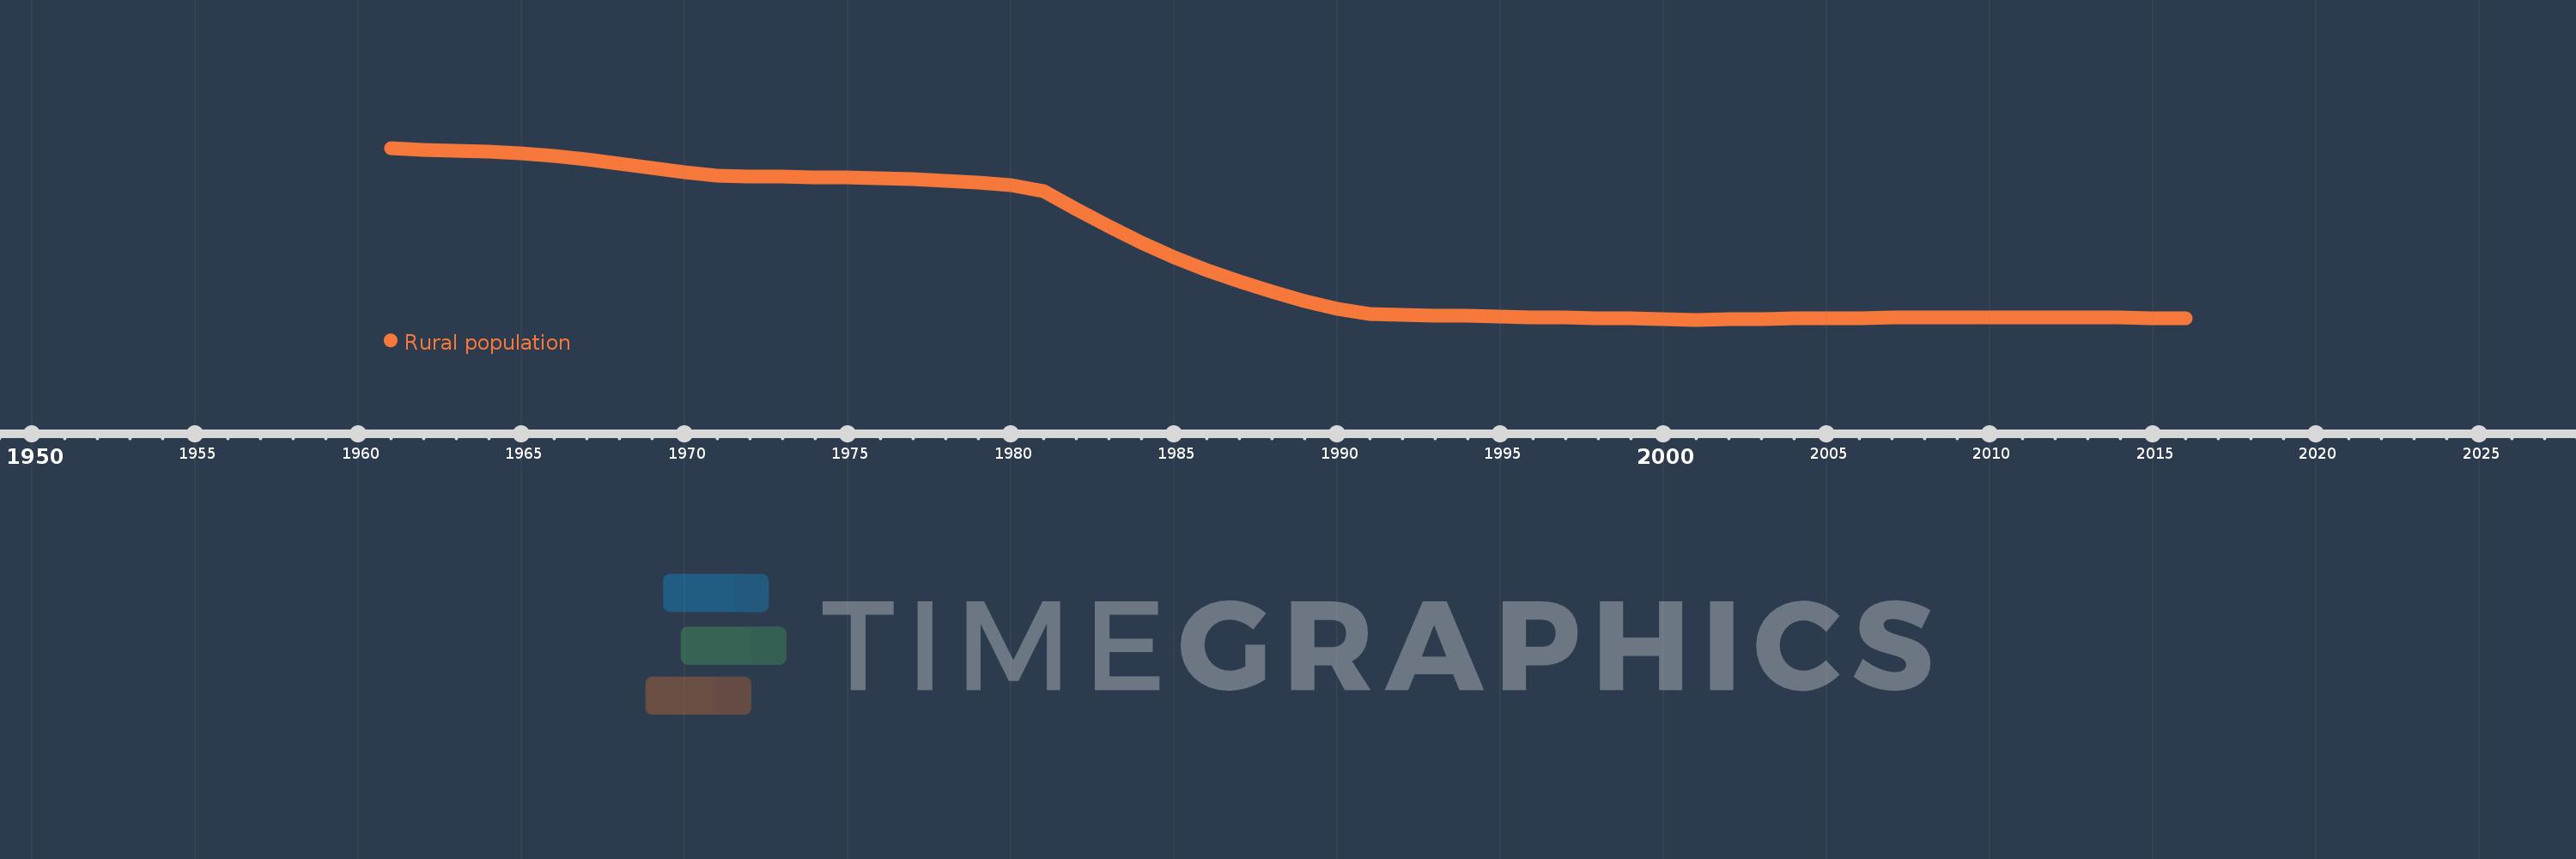
Rural population
2016,2015,2014,2013,2012,2011,2010,2009,2008,2007,2006,2005,2004,2003,2002,2001,2000,1999,1998,1997,1996,1995,1994,1993,1992,1991,1990,1989,1988,1987,1986,1985,1984,1983,1982,1981,1980,1979,1978,1977,1976,1975,1974,1973,1972,1971,1970,1969,1968,1967,1966,1965,1964,1963,1962,1961
This statistics in other country:
AfghanistanAlbaniaAlgeriaAmerican SamoaAndorraAngolaAntigua and BarbudaArab WorldArgentinaArmeniaArubaAustraliaAustriaAzerbaijanBahamas, TheBahrainBangladeshBarbadosBelarusBelgiumBelizeBeninBermudaBhutanBoliviaBosnia and HerzegovinaBotswanaBrazilBritish Virgin IslandsBrunei DarussalamBulgariaBurkina FasoBurundiCabo VerdeCambodiaCameroonCanadaCaribbean small statesCayman IslandsCentral African RepublicCentral Europe and the BalticsChadChannel IslandsChileChinaColombiaComorosCongo, Dem. Rep.Congo, Rep.Costa RicaCote d'IvoireCroatiaCubaCuracaoCyprusCzech RepublicDenmarkDjiboutiDominicaDominican RepublicEarly-demographic dividendEast Asia & PacificEast Asia & Pacific (excluding high income)East Asia & Pacific (IDA & IBRD countries)EcuadorEgypt, Arab Rep.El SalvadorEquatorial GuineaEritreaEstoniaEthiopiaEuro areaEurope & Central AsiaEurope & Central Asia (excluding high income)Europe & Central Asia (IDA & IBRD countries)European UnionFaroe IslandsFijiFinlandFragile and conflict affected situationsFranceFrench PolynesiaGabonGambia, TheGeorgiaGermanyGhanaGibraltarGreeceGreenlandGrenadaGuamGuatemalaGuineaGuinea-BissauGuyanaHaitiHeavily indebted poor countries (HIPC)High incomeHondurasHong Kong SAR, ChinaHungaryIBRD onlyIcelandIDA & IBRD totalIDA blendIDA onlyIDA totalIndiaIndonesiaIran, Islamic Rep.IraqIrelandIsle of ManIsraelItalyJamaicaJapanJordanKazakhstanKenyaKiribatiKorea, Dem. People’s Rep.Korea, Rep.KuwaitKyrgyz RepublicLao PDRLate-demographic dividendLatin America & Caribbean Latin America & Caribbean (excluding high income)Latin America & the Caribbean (IDA & IBRD countries)LatviaLeast developed countries: UN classificationLebanonLesothoLiberiaLibyaLiechtensteinLithuaniaLow & middle incomeLow incomeLower middle incomeLuxembourgMacao SAR, ChinaMacedonia, FYRMadagascarMalawiMalaysiaMaldivesMaliMaltaMarshall IslandsMauritaniaMauritiusMexicoMicronesia, Fed. Sts.Middle East & North AfricaMiddle East & North Africa (excluding high income)Middle East & North Africa (IDA & IBRD countries)Middle incomeMoldovaMonacoMongoliaMontenegroMoroccoMozambiqueMyanmarNamibiaNauruNepalNetherlandsNew CaledoniaNew ZealandNicaraguaNigerNigeriaNorth AmericaNorthern Mariana IslandsNorwayOECD membersOmanOther small statesPacific island small statesPakistanPalauPanamaPapua New GuineaParaguayPeruPhilippinesPolandPortugalPost-demographic dividendPre-demographic dividendPuerto RicoQatarRomaniaRussian FederationRwandaSamoaSan MarinoSao Tome and PrincipeSaudi ArabiaSenegalSerbiaSeychellesSierra LeoneSingaporeSint Maarten (Dutch part)Slovak RepublicSloveniaSmall statesSolomon IslandsSomaliaSouth AfricaSouth AsiaSouth Asia (IDA & IBRD)South SudanSpainSri LankaSt. Kitts and NevisSt. LuciaSt. Vincent and the GrenadinesSub-Saharan Africa Sub-Saharan Africa (excluding high income)Sub-Saharan Africa (IDA & IBRD countries)SudanSurinameSwazilandSwedenSwitzerlandSyrian Arab RepublicTajikistanTanzaniaThailandTimor-LesteTogoTongaTrinidad and TobagoTunisiaTurkeyTurkmenistanTurks and Caicos IslandsTuvaluUgandaUkraineUnited Arab EmiratesUnited KingdomUnited StatesUpper middle incomeUruguayUzbekistanVanuatuVenezuela, RBVietnamVirgin Islands (U.S.)West Bank and GazaWorldYemen, Rep.ZambiaZimbabwe Timeline:
This timeline shows a graph from 1961 to 2016 of Puerto Rico. No data until 1960. Number of actual observations by date: 56.
Source name:
World Development Indicators
Source organization:
The data on urban population shares used to estimate rural population come from the United Nations, World Urbanization Prospects. Total population figures are World Bank estimates.
Categories, topics:
Agriculture & Rural Development
Last updated:
apr 23, 2017
Indicators value changes by year
Minimum:
213.889K
jan 1, 2001
Maximum:
1.308 mln
jan 1, 1961
At the date of observation
Value
Absolute change
Change from previous value
jan 1, 1961
1.308 mln
+1.308 mln
0.0%
jan 1, 1962
1.297 mln
-10.124K
-0.77%
jan 1, 1963
1.291 mln
-6.8K
-0.52%
jan 1, 1964
1.284 mln
-6.435K
-0.5%
jan 1, 1965
1.274 mln
-10.408K
-0.81%
jan 1, 1966
1.257 mln
-16.348K
-1.28%
jan 1, 1967
1.236 mln
-21.646K
-1.72%
jan 1, 1968
1.209 mln
-27.118K
-2.19%
jan 1, 1969
1.179 mln
-29.462K
-2.44%
jan 1, 1970
1.152 mln
-27.123K
-2.3%
jan 1, 1971
1.133 mln
-19.473K
-1.69%
jan 1, 1972
1.126 mln
-6.5K
-0.57%
jan 1, 1973
1.123 mln
-2.821K
-0.25%
jan 1, 1974
1.122 mln
-1000.0
-0.09%
jan 1, 1975
1.12 mln
-2.334K
-0.21%
jan 1, 1976
1.115 mln
-5.324K
-0.48%
jan 1, 1977
1.107 mln
-7.829K
-0.7%
jan 1, 1978
1.097 mln
-10.105K
-0.91%
jan 1, 1979
1.085 mln
-12.075K
-1.1%
jan 1, 1980
1.072 mln
-13.146K
-1.21%
jan 1, 1981
1.031 mln
-40.301K
-3.76%
jan 1, 1982
915.308K
-115.902K
-11.24%
jan 1, 1983
806.057K
-109.251K
-11.94%
jan 1, 1984
704.908K
-101.149K
-12.55%
jan 1, 1985
612.522K
-92.386K
-13.11%
jan 1, 1986
529.615K
-82.907K
-13.54%
jan 1, 1987
455.619K
-73.996K
-13.97%
jan 1, 1988
390.306K
-65.313K
-14.34%
jan 1, 1989
333.043K
-57.263K
-14.67%
jan 1, 1990
283.432K
-49.611K
-14.9%
jan 1, 1991
249.641K
-33.791K
-11.92%
jan 1, 1992
245.572K
-4.069K
-1.63%
jan 1, 1993
241.39K
-4.182K
-1.7%
jan 1, 1994
237.755K
-3.635K
-1.51%
jan 1, 1995
234.354K
-3.401K
-1.43%
jan 1, 1996
230.967K
-3.387K
-1.45%
jan 1, 1997
228.098K
-2.869K
-1.24%
jan 1, 1998
224.814K
-3.284K
-1.44%
jan 1, 1999
220.778K
-4.036K
-1.8%
jan 1, 2000
216.681K
-4.097K
-1.86%
jan 1, 2001
213.889K
-2.792K
-1.29%
jan 1, 2002
216.41K
+2.521K
1.18%
jan 1, 2003
218.792K
+2.382K
1.1%
jan 1, 2004
220.995K
+2.203K
1.01%
jan 1, 2005
223.184K
+2.189K
0.99%
jan 1, 2006
225.002K
+1.818K
0.81%
jan 1, 2007
226.182K
+1.18K
0.52%
jan 1, 2008
227.018K
+836.0
0.37%
jan 1, 2009
227.833K
+815.0
0.36%
jan 1, 2010
228.763K
+930.0
0.41%
jan 1, 2011
229.804K
+1.041K
0.46%
jan 1, 2012
229.148K
-656.0
-0.29%
jan 1, 2013
228.173K
-975.0
-0.43%
jan 1, 2014
227.226K
-947.0
-0.42%
jan 1, 2015
224.96K
-2.266K
-1.0%
jan 1, 2016
222.348K
-2.612K
-1.16%
Ranking of countries by current statistics by years


Comments: